Contents
You can skip ahead to any of the sections of this guide by clicking on the underlined bookmarks below.
Some basics you should know
Setup
- What You Need to Xert
- Getting To Know Your ‘My Fitness’ Page
- Establish Your Fitness Signature & Goals
Train
Review
Other
Some Basics You Should Know
What Xert Is, And What It Does
Xert is a smart training platform that helps athletes coach themselves, and helps coaches to guide others, using the data from a cycling or running power meter.
‘Smart’ means that Xert dives deep into your data to discover patterns unique to you, and to use this to provide adaptive and intuitive recommendations, adjusting in real-time to your unique needs and fitness. It adjusts its recommendations to missed days or double days, increasing or decreasing fitness, different degrees of fatigue, changing goals, and it even adjusts on-the-fly depending on how well (or not well) an interval is being executed. And one of the biggest benefits of Xert? You never have to do another dreaded FTP test…with Xert, your fitness (and Threshold Power) is obtained directly from your data when the system detects that you have had a fitness breakthrough (more below).
What Makes Xert Different
Xert is the first platform of its kind, allowing a relative novice to self-coach, or an expert to coach others. Some of the features that separate Xert from others platforms include:
- It tracks changes in your fitness without requiring testing. Just upload your data and Xert tells you when you’re improving and by how much, automatically.
- It’s adaptive (‘smart’). Training advice, workouts, performance metrics, and more, dynamically adjust every day, every hour, and every second (e.g. during a ride).
- It creates a multi-parameter view of your fitness (see Fitness Signature under Key Terms)
- It can be used indoors and outdoors, riding or running (with a run power meter)
- It makes sense of all your activities to help you understand how they will fit into your training plan
- It offers apps & Garmin datafields to present live performance feedback whether your doing an interval, in the middle of a race, or just riding with friends.
➤➤ Click here for a more complete list of features.
Key Terms
As an industry-first, Xert uses some unique terminology. Some of it is similar to other concepts in the world of training with power, whilst others are entirely new.
- Fitness Signature: A multi-parameter representation of your fitness, made up of three metrics:
- Threshold Power (TP): the highest power that can be sustained without accumulating short-term fatigue. Similar to Maximal Lactate Steady State (MLSS) and Functional Threshold Power (FTP). Measured in watts.
- High Intensity Energy (HIE): the amount of energy or work capacity you have above Threshold Power (TP). Similar in many ways to W’ and Anaerobic Work Capacity (AWC). Measured in kilojoules.
- Peak Power (PP): your highest possible 5-second power when not fatigued. Sometimes referred to as Pmax. Measured in watts.
- Maximal Power Available (MPA): the maximum power you can generate at any given moment during exercise. MPA starts at your Peak Power and as you fatigue, it declines. As you recover, it increases; with enough recovery it will eventually return to Peak Power. When MPA declines and/or your power increases such that your current power is equal to MPA, it’s called a maximal-effort or point-of-failure. Exceeding this point will deliver a fitness breakthrough, which means your fitness has improved. Check out this blog for a deeper explanation: Understanding MPA.
- Strain / XSS: used to calculate your training load. In the same way Xert determines MPA, it also determines how the work you’ve been doing is going to affect your fitness. This is captured as XSS, or Xert Strain Score.
- Focus: a time duration or Athlete Type. Similar to Zones, Focus is what Xert uses to make sense of the various low, high and peak intensity efforts you do during workouts. It is particularly useful when there is a lot of variation in the power data. Focus helps you understand what your events demand in terms of fitness and how to use this to guide your training to prepare and improve.
- Improvement Rate: the rate at which you’d like your training load to increase. Xert bases training recommendations on where your training load is today and at what rate you’d like to improve; it takes the guesswork out of choosing the right training plan. The higher the Improvement Rate, the more training you will need to perform. Often called Ramp Rate.
- Xert Adaptive Training Advisor: the smart training recommendation engine inside Xert that determines the amount, and type, of training you need to do to reach your goals.
- Fitness Breakthrough: this is achieved when your power reaches or surpasses your MPA for longer than 5 seconds during an activity, and indicates that your fitness has improved.
➤➤ For a full list, see our Glossary.
Setup
What You Need to use Xert
(Required) To Analyze your Data and Track Your Fitness Improvements:
- Power meter and/or power-enabled trainer (if only training indoors)
- A device to capture your power data e.g. a cycling computer or mobile phone
- Strava or Garmin Connect account or a collection of FIT/TCX files to load your power data into Xert
- You DO NOT need to download any desktop software for Xert!
(Optional) To Do Xert’s Structured Training:
- iPhone OR Android phone OR Garmin ConnectIQ-enabled bike computer OR a Zwift account
(Optional) Other Features:
- Use Xert’s Garmin apps such as MPA and Segment Hunter with a Garmin ConnectIQ-enabled bike computer
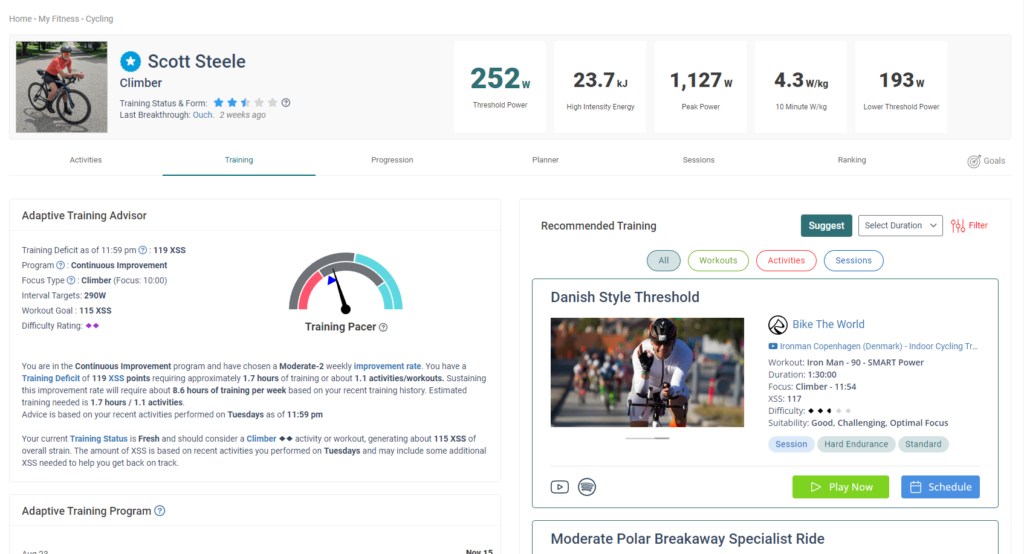
Getting To Know Your ‘My Fitness’ Page
Before you start training with Xert, you should take a moment to familiarize yourself with the page you will likely use most often – your ‘My Fitness’ page. Below is a quick view of the most used buttons and features.
Establish Your Fitness Signature & Goals
The two most important steps before you start training with Xert are to establish your Fitness Signature (Xert will do this automatically once you have synced your data) and to set your goals.
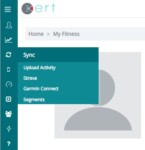 Step 1: Sync your activity history.

- Import a minimum of 3 months of power data to establish your Fitness Signature. You can import activities by syncing with Strava, Garmin Connect, or importing them manually. We recommend syncing with Strava since it allows you to add activities from the past. Garmin Connect will only add the latest activity.
- Set up your sync settings so that any new activities or workouts you do are automatically added to your Xert profile.
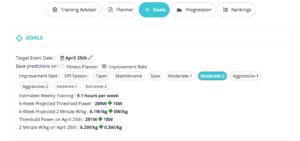 Step 2: Establish your goals.
- Set your Athlete Type (in your Account Settings), Improvement Rate and Target Event Date (in the Goals tab). Select your Athlete Type based on your goals.

Train
Planning Your First Workout
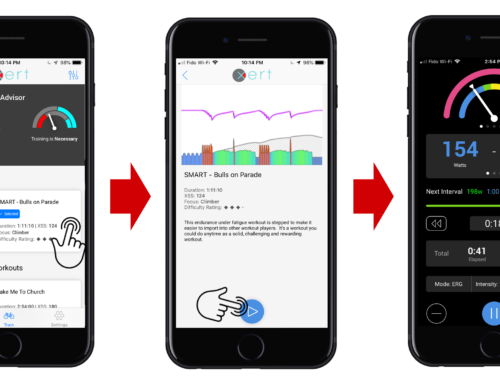
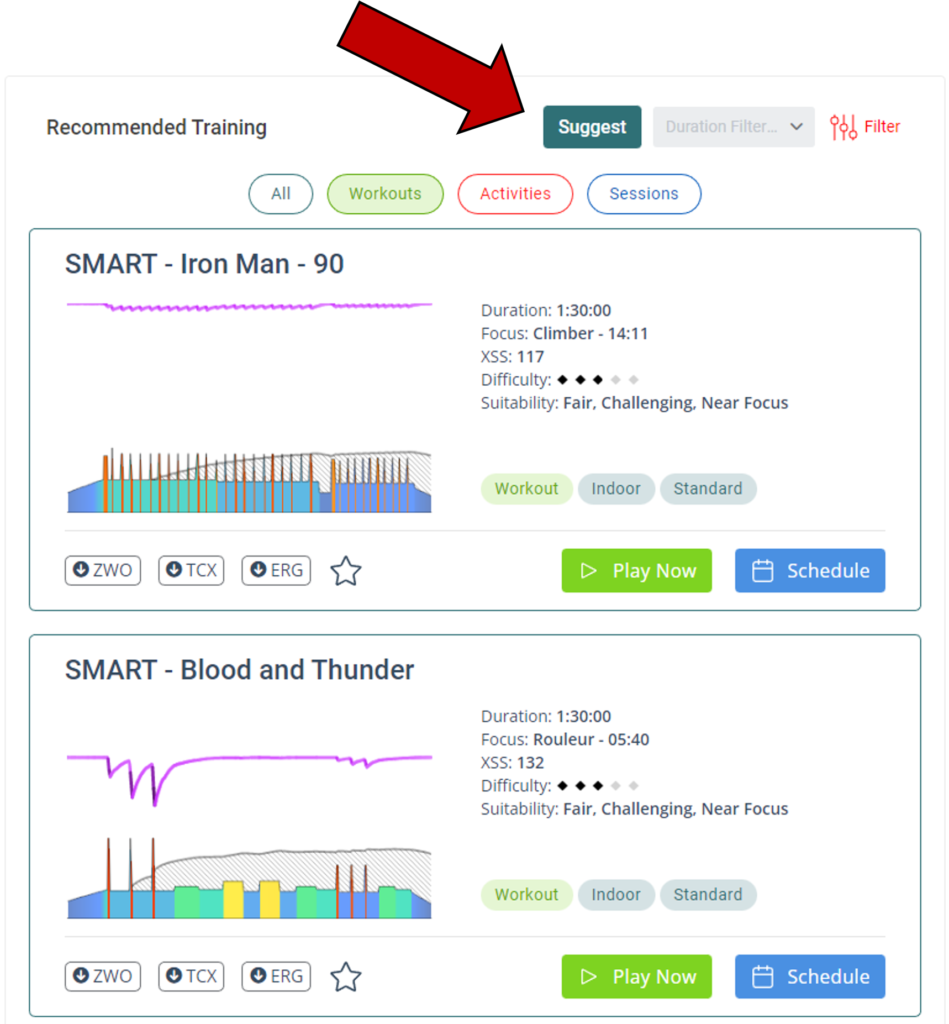
To achieve the goals you provide to Xert, it’s as easy as following the daily advice of the Adaptive Training Advisor. How do you do that?
Step 1: Look at your Training Pacer and/or the details of the Advisor. Are you on track? Do you need to train today/now? How much do you need to train today?
Step 2: Train. Here, you have a couple options:
- Train NOW: If you’re ready to train now, either:
- Select a workout that aligns with the advice (or have the right workout automatically selected for you). Xert will automatically list and rank the best workouts for you at that that moment.
- Use the recommendations of the Advisor as a rough guide for your workout. Remember, Xert will makes sense of structured & unstructured activities to determine how they fit into your training plan.
- Just ride or run how you feel. Xert will makes sense of the activity and fit into your training plan.
- Train LATER: Plan a workout for later from your Fitness Planner page. Click on the date in the calendar, update the time of your workout, and select from the list of recommended workouts.
PRO TIP! You don’t need to plan ahead; in fact, Xert works best if you don’t! Click ‘Suggest’ and the Adaptive Training Advisor will recommend training based on your latest fitness and activities. If you want to plan ahead, we recommend planning no more than a week ahead.
TIP! Set your ‘As Of‘ time to coincide with the typical time of your workouts. This will also tell the system when you’d like your status (fresh, tired, etc.) to be calculated on your Fitness Planner page.
Step 3: Review your hard work to see how you improve! See more at ‘Reviewing Your Progress‘ below.
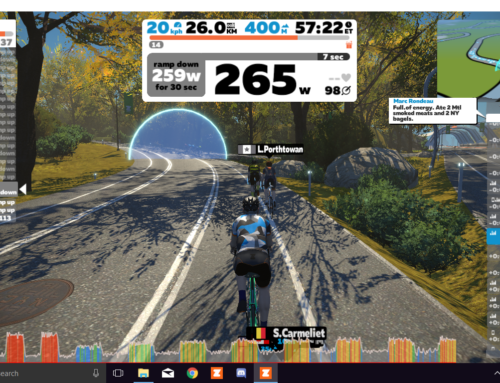
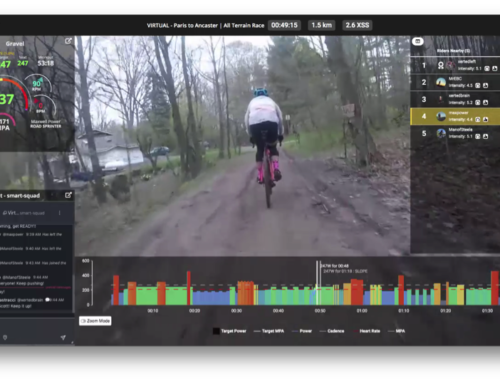
Doing Your First ‘Structured’ Workout
If you selected a structured workout from the list of recommended workouts, you can do that workout indoors or outdoors with the help of the Xert Workout Player app for iOS, Android or Garmin. Follow the links below for instructions on how to set up and use the app on your preferred device.
Review
Reviewing Your First Activity
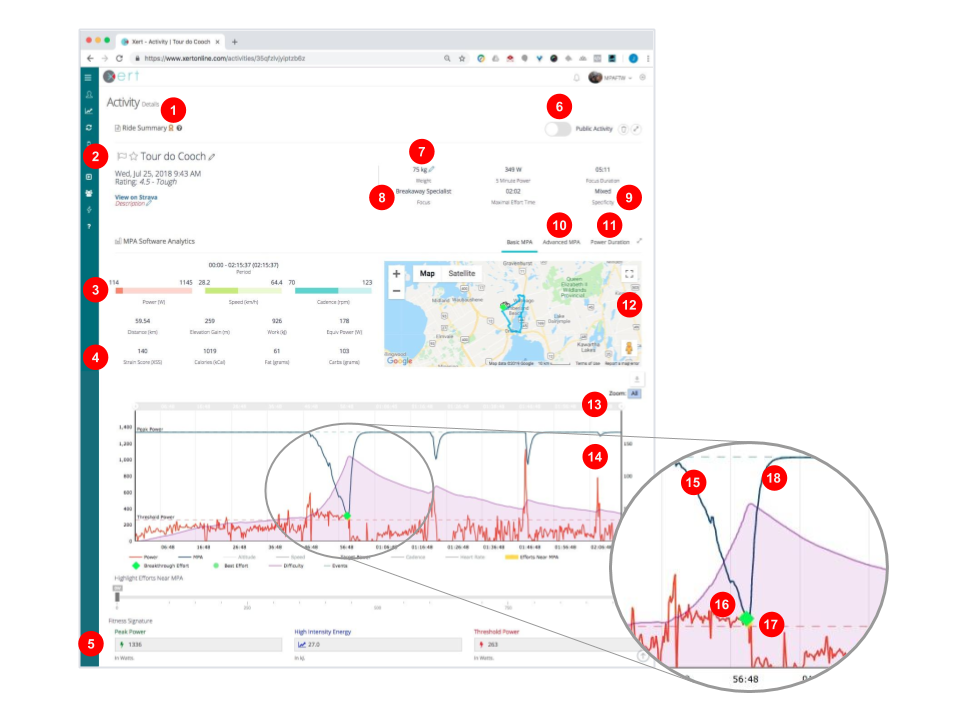
Once you’ve done your first activity, you can review it to understand how it fits into your plan, the calories you burned, and much more. You can select your activity from either the Activities Table or the Activities Dashboard. Here is what you’ll see inside your activity:
- Review the details of your Fitness Breakthrough, if you had one.
- Star an activity to add it to your ‘Favourites’ list, or Flag the activity to exclude it from your Fitness Signature calculation (only if the data is wonky).
- See your maximum & average power, speed, cadence, and where your average fits in a distribution between your minimum and maximum.
- Review the distance, Strain, and caloric expenditure of your activity (note that the calories burned don’t include basal metabolic rate)
- See your Fitness Signature. If you had a Breakthrough, viewing your Fitness Signature within the ‘Advanced MPA’ tab will also reveal the changes to your Fitness Signature as a result of the Breakthrough.
- Share your activity by making it public. Copy the URL to post or send to a friend.
- Update your weight
- Review the Focus of your activity.
- Review the Specificity of your activity.
- Use the Advanced MPA tab to see your current and previous Fitness Signature (if you had a breakthrough), or to manually adjust your Fitness Signature (an advanced feature).
- Open the ‘Power Duration’ tab to see your current Fitness Signature, the Signature for this activity, and the Mean Maximal Power for this activity.
- See a map of your ride or run.
- Zoom into your MPA chart by moving the slider on either side of the timeline, or with a ‘click-and-drag’ on the MPA chart. To restore the full view, click ‘Zoom: All’.
- Review your MPA chart with the following metrics (NOTE: You can add or remove metrics from your MPA chart by clicking on its title in the legend):
- Red line: your second-by-second power
- Dark blue line: your second-by-second MPA
- Purple line and area: the difficulty at any given moment.
- Your MPA line. In this case, it’s coming down as work is done above threshold.
- The green diamond appears at the moment you had your BREAKTHROUGH! The power (red line) has met the blue line (MPA)
- Though difficult to see in this example, the power line has changed from red to yellow. This represents the period of time power exceeded MPA / predicted ceiling of performance. A new Fitness Signature is extracted from this activity.
- As this athlete rested after the intense effort, MPA recovered.
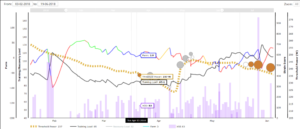
Tracking Your Progress
From your My Fitness page you can see a quick chart that displays your progress. Under ‘Progression’ there are a number different views and features. Here is a quick summary to get you started.
- The overall period you’d like to display
- Summary statistics over the selected period
- The period displayed if you have zoomed into a portion of the time period
- The slider (one on the left and one on the right) to zoom into a portion of the time period. Click-and-drag on the chart will also zoom in. Click “Zoom All” at the far right to zoom back out.
- Show/hide future activities included in your Fitness Planner by sliding the toggle to the right. Enabling this feature is a great way to reveal the impact of your planned workouts on your fitness and freshness.
- Select which chart you’d like to see. NOTE: You can add or remove metrics from your MPA chart by clicking on it in the legend.
- XPMC: displays your Training Load, Threshold Power, Strain (XSS) of each activity, Form (Brown=detraining, Green=very fresh, Blue=fresh, Yellow=tired, Red=very tired), and Recovery Load. Select/deselect any of these metrics in the legend to display or remove them from the chart.
- Stress: accumulated peak, high, and low stress
- Strain: peak, high and low strain by activity, Focus by activity, and Threshold Power
- Fitness Signature: review how your Fitness Signature parameters have changed over time. By adding additional metrics to the chart (select them in the legend) you can see how other metrics may be related to changes in your signature.
- Chart legend
- Your Training Load
- Your Threshold Power on that day (see ‘Fitness Signature Decay‘ to understand why it’s declining)
- The XSS (Strain) of each day’s activity. If you have more than one activity on a given day, you’ll see one XSS bar superimposed over another, like on the last day of this example.
- Your Form directly after this day’s activity.
- Any time a circle appears, a fitness breakthrough (or near breakthrough) occurred. The colours signify how many of your signature parameters changed: Gold=all 3, Silver=2 out of 3, Bronze=1, White/clear: a ‘near’ breakthrough (also called a ‘fakethrough’) meaning your signature declined. The size of the circle signifies how significant was the change in your signature. You can click on the coloured circle to be taken to the activity details.
Other
There are many other features to be discovered in Xert. To keep up to date as we add more, and for tips & tricks, subscribe to the newsletter, read the blog, or explore the support page. Here are some popular features and FAQ’s
Popular Features
- How to add Xert workouts to Zwift
- The Xert Segment Hunter (for Garmin)
- The Xert Remote Player
- Xert ‘Smart’ Workouts
- The Freshness Feedback feature
- Fitness Signature Decay
Popular FAQ’s & Tips
- Is my Fitness Signature right?
- Adding, updating and troubleshooting Garmin datafields & apps
- Entering ‘Manual’ Activities (no power data)
- Understanding ‘Focus’ and how to use it
- When to use the ‘Recalculate Progression’ feature on your Fitness Signature
- The Ultimate Guide to Training with Xert and Zwift
- Why is my Threshold Power higher than I expect?
➤➤ For more, see our FAQ’s page
Support
If you have questions or need support, here are your options:
- Email our friendly support team;
- Browse or engage the Xert Users group on Facebook;
- Ssearch our Support site
- Post a question on our Forum (recommended if you don’t have a Facebook profile)