The Next Generation in Impulse Response Modeling
With our success helping athletes answer the question: “What’s my fitness?”, we set our sights on answering the question “What will my fitness be?”. Answering this question is difficult, since it requires a prediction of what is going to happen to your fitness based on the training (or lack thereof) you plan on doing. In order to successfully predict fitness, we’ll need to look for patterns on how fitness had changed based on previous work, or better still strain obtained during activities in the past. From these patterns, we can input the training activities you are planning, extrapolate the strain you will obtain and thus predict what your Fitness Signature will be. Moreover, if we are interested in maximizing a fitness outcome and have predefined what available time there is to train together with the target event date, we can establish fitness potential as the highest fitness one can attain based on available time to train. The output of this would be the optimal training plan.
The implementation of the Xert fitness prediction and potential model is following a three phase process:
Phase I – A Standard Impulse Response Model
Today we released the Xert Progression Management Chart (XPMC). The XPMC is based on a new metric – Xert Strain Score (XSS) – created to provide a way to normalize strain during activities athletes perform. The derivation of XSS establishes the value of 100 as the XSS value corresponding to 1 hour at Threshold Power. This normalization is familiar to many as it is the basis used in practice by many coaches and athletes XSS is analogous and interchangeable with stress scores used in other software programs. Here is a comparison chart:

The main difference between XSS and stress scores that use power normalization methods, such as a 30 second moving average, is three fold:
- XSS does not accumulate during periods of rest. XSS is based on actual work performed. If no work is being performed, no additional strain is accumulated.
- XSS increases the closer you reach your limits. XSS is based on Xert’s strain. The closer you are to your limit, the greater the strain and the greater your XSS.
- XSS accounts for very short efforts. Whereas 30 second power averaging may ignore strain caused by short, bursty efforts, XSS takes all work performed into account in determining your score.
Below is a chart that shows the effects of an equal work-to-rest ratio workout based on various interval durations. We used data from an athlete with a Fitness Signature that has a Threshold Power of 300W, High Intensity Energy of 25kJ and Peak Power of 1200W. The scores are based on equal work-to-rest at an interval power of 350W with a equivalent rest at 100W for 1 hour workout:

The scores are similar for durations greater than 40 seconds and less then 200 seconds. As the interval durations decrease below 40 seconds, there is significant divergence as the 30 second moving average does not account for the impact of these shorter efforts. Likewise, as the durations increase and the athlete starts to perform closer their limit, there is also significant divergence. (The athlete’s longest possible interval at 350W/100W equal work:rest is 474 seconds.)
Here is a table with some specific values for comparison:
| 1 Hour Workout | Stress Score | Strain Score |
|---|---|---|
| Microintervals – 15s on at 350W / 15s off at 100W | ||
| 60s Intervals @350W with 60s @100W rest-in-between | ||
| 6 minute Intervals @350W with 6 minute @100W rest-in-between |
Counteracting this divergence is the inflation from rest caused by the use of entire-ride averaging. This ride, for example, has significant divergence between scores as a result of the two stops in the middle of the ride. XSS is 323 where as the stress score based on power normalization is 364:

In the end, the overall values remain very closely correlated but on an individual activity basis, there can be significant divergence. If one’s activity history contains periods where there is a prevalence of activities that inflate or under estimate strain scores, the difference in accumulated training loads may be material to the interpretation of of the athlete’s data.
Xert Equivalent Power
In this latest release, we also introduce another metric – Xert Equivalent Power (XEP). XEP is derived from XSS and represents the power the athlete would have experienced without accounting for strain from increased intensity or fatigue. Like XSS, the correlation between XEP and using average power normalization across activities will be high but unlike XSS, on an individual activity level, there will be larger variance. Notably, if your activities have long periods of rest, XEP may be lower. Conversely, if you have many efforts near your MPA or you have many shorter duration efforts, XEP will be higher. Note that XEP is derived from XSS, rather than the other way around. Relative differences experienced with XEP don’t necessarily mean the same relative differences in XSS.
Here is a comparison of the same equal work:rest workout as above:
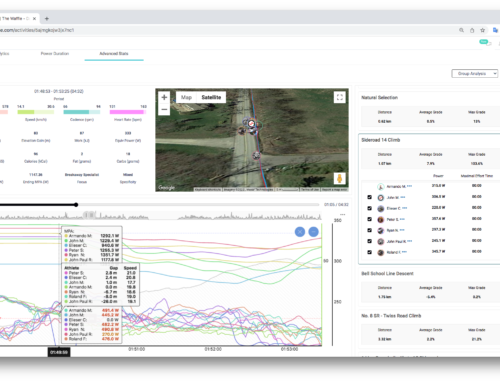
The Xert Progression Management Chart

Accumulating XSS using a exponentially-weighted moving average, the XPMC provides a chart of the following:
- Training Load
- Recovery Load
- Form
- XSS for Activities
The chart also optionally overlays breakthroughs or activities with near breakthroughs – Best Activities – overtop the XSS bars for easy reference.
The XPMC is a familiar chart to most athletes and coaches that train and race with power. The main distinction is in the use of XSS as the driving metric. Generally, the XPMC will track in a similar fashion. However, differences can accumulate and end up providing alternative interpretations.
XSS and XEP in Real-Time
With this release, we are also announcing a new Garmin ConnectIQ App: XSS and XEP for ConnectIQ and the availability of XSS and XEP for Xert Mobile.
XSS and XEP for ConnectIQ is configured with your Garmin Xert Code and can show XSS and XEP in real-time for your entire activity or for the current lap using the settings available in Garmin Express or Garmin Connect Mobile. XSS and XEP are now available as selectable metrics on any cell in Xert Mobile using tap-and-hold.
Phase II – A Comprehensive Predictive Model
Athletes and coaches are familiar with the standard impulse response model and it’s part-and-parcel of the methods they use to infer what an athlete’s training status and form will be at a given point in time. Predicting fitness is as much an art as it is science in using this tool to plan for fitness and peaks for competitions. To move closer to fitness prediction and potential, are more comprehensive model is needed.
Banister’s Impulse-Response Model provides a well known and proven method used to predict outcomes. It is used as the basis for the standard XPMC. In order for the model to have a true predictive capability, it requires that the parameters that govern the fitness predictions are continually updated to reflect the up-to-date information about the athlete. The model looks like this:
Fitness(t) = Fitness(0) + k1 * Training Load (tau1) – k2 * Recovery Load(tau2)
With Xert, we are using the Xert Strain Score which is a good reflection of the strain obtained from training and racing. However, we can also allocate strain into Peak, High and Low using allocation ratios. Hence, our singular model becomes three separate but linked models:
PeakPower(t) = PeakPower(0) +pk1 * PeakTrainingLoad(ptau1) – pk2 * PeakRecoveryLoad(ptau2)
HighIntensityEnergy(t) = HighIntensityEnergy(0) +hk1 * HighTrainingLoad (htau1) – hk2 * HighRecoveryLoad(htau2)
ThresholdPower(t) = ThresholdPower(0) +lk1 * LowTrainingLoad (ltau1) – lk2 * LowRecoveryLoad(ltau2)
To apply this three tier impulse response model, regression software needs to be developed that will obtain estimates of the parameters. Then, using breakthrough fitness signatures and strain scores divided into peak, high and low strain scores as data to the regression, parameter estimates can be established. Data from a population of athletes, a sub-population, e.g. male/female, elite/masters or even from a single athlete where sufficient data exists, can be used in the regression software to determine parameter values.
At the moment, the software for this regression has been successfully developed and tested and will soon be part of Xert. When this is coupled with the ability to define future workouts, predictions of what your fitness will be – your fitness signature – on a given day in the future can be made. Fold in the ability to have the software auto-prescribe training that maximizes your signature towards a certain desired goal – the relative change in each fitness signature parameter – and we can then provide a measure of fitness potential and training optimization.
Phase III – A Machine Learning System
In the third phase, we move beyond Banister’s Impulse Response model and towards an even more sensitive prediction model, one that can use other data such as HRV data and data from other sensors to find patterns not captured by our current models. These new methods will help identify greater details that will improve fitness, identify patterns that lead to over-training and prescribe training that can be used in a variety of activities.