Synonymous with Power-Duration Chart and Power-Duration Curve (PDC), this describes the relationship between how long an athlete can sustain a given power with a few assumptions:
- Starting from fresh
- Riding at a steady-state, and
- Ending with the inability to sustain the given power.
Note: Inability to sustain the given power is called a point-of-failure.
In Xert, your power-duration relationship is determined by applying a special use-case of MPA. The duration that an athlete can sustain a given fixed work rate (i.e. state-state power) is determined by calculating how long will it take MPA to reduce from Peak Power until steady-state power equals MPA. This calculation can be performed at any given intensity to determine duration or using a given duration to determine the steady-state power. Note that since the athlete’s Fitness Signature is used to formulate MPA, your Fitness Signature can be depicted as a power-duration curve for visualization and to help interpret fitness.
An alternative approach to defining the power curve is to use Mean Maximal Power (MMP) data. Using MMP generally results in similar values to steady-state, fresh-to-failure efforts as described above but can have more variance. A power curve defined using MMP data, obtains the highest average power over a given duration from an athlete’s power data. There is a presumption that the efforts are started from fresh, didn’t have periods of rest or partial rest and ended with the athlete’s inability to sustain the average power over the period. One must acknowledge that the occurrence of such data – where the athlete starts from fresh, doesn’t have any moments where power drops below Threshold Power and where the athlete’s inability to sustain the average power did not precede nor could have succeeded the end of the period – is rare in regular power data.
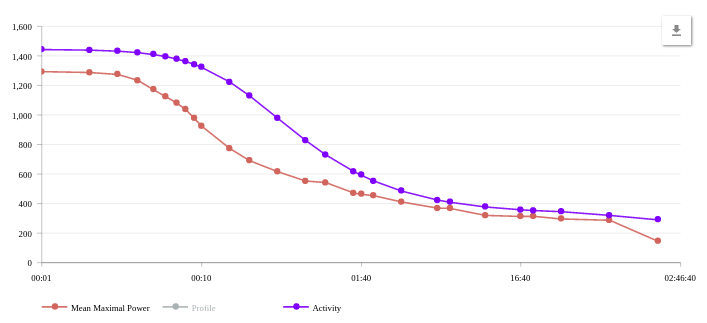
Below are two power curves, the red curve is derived from MMP data whereas the purple curve is derived by determining the Fitness Signature that expressed the MPA for the activity. Only when the red and purple coincide, was the corresponding MMP effort started from fresh, didn’t have moments below TP and ended in a point-of-failure. In this sample activity, no MMP efforts exhibited this.