
An Introduction to Xert Relative Power
A Bit of Background on Power-to-Weight Ratio
For anyone that’s ever watched a professional cycling race or raced in Category-based races, you’re likely to be familiar with power-to-weight ratio or watts per kilogram (W/kg): take your power output and divide it by your weight in kilograms. This is the key metric that is used today when comparing one rider’s power vs. another rider’s:
- Pogi rode this climb at 7 W/kg for 40 minutes.
- The minimum FTP for this category race is 4.5 W/kg.
- Xert Surplus Seekers Zwift Group Ride is a 2.0 – 2.5 W/kg event.
The higher W/kg you can sustain, means the stronger a rider you are. To get better, either you need to increase your power, decrease your weight, or both. Being lighter is said to improve your performance hence many cyclists go on weight-loss diets to try and improve this metric. If you can maintain your power but lose weight, your W/kg goes up making you a faster rider. At least that’s what most people think.
However, many sports scientists have argued that W/kg is a great way to compare climbing ability, but the metric isn’t as useful on flat terrain. Bigger riders have an advantage over smaller riders when it comes to riding on flat roads. In fact, on a downhill section of road being heavier is better than being lighter. Bigger riders descend faster than smaller riders. The notion that W/kg isn’t as effective for rider comparisons on flatter terrain has been well known for many years by those that have studied the sport. Raw power on flatter terrain is better than W/kg whereas W/kg is better than raw power on steeper gradients.
Recently Published Research
Recently, research was published on using a new formula to better assess athletes called Compound Score. The research paper can be found here. The formula is pretty simple as it takes an athlete’s W/kg and multiplies it by watts:
}")
This simple formula is used to better compare the performance of one athlete vs. another over mixed terrain. The research shows that overall this does better than using W/kg in predicting which athletes will perform better. However, if the race is a mountain stage and the majority of the race is steep climbing, using W/kg is still better than using Compound Score.
Going One Step Further – Laying a New Foundation
What’s abundantly clear is that any real valuable comparison metric must take into account the gradient that will be used for the comparison and not just power and weight: the steeper it is, the more W/kg matters. The flatter it is, the more watts matters. To best illustrate this, we’re going to do a bit of math to help you understand what these all mean:

}") which is essentially
which is essentially 

Note the exponent shown in the above formulas. We’ll call this exponent the Kilogram Exponent or KGE. It is the exponent that’s applied to the weight in the denominator. What’s clear is that KGE depends on the terrain and the gradient that is used for comparison. The steeper the gradient, the closer to 1 it should be and the flatter the terrain, the lower the number needs to be. At Xert, we went through the trouble to estimate the relationship between gradient and KGE using a physical model and generalized CdA and rolling resistance values based on weight:
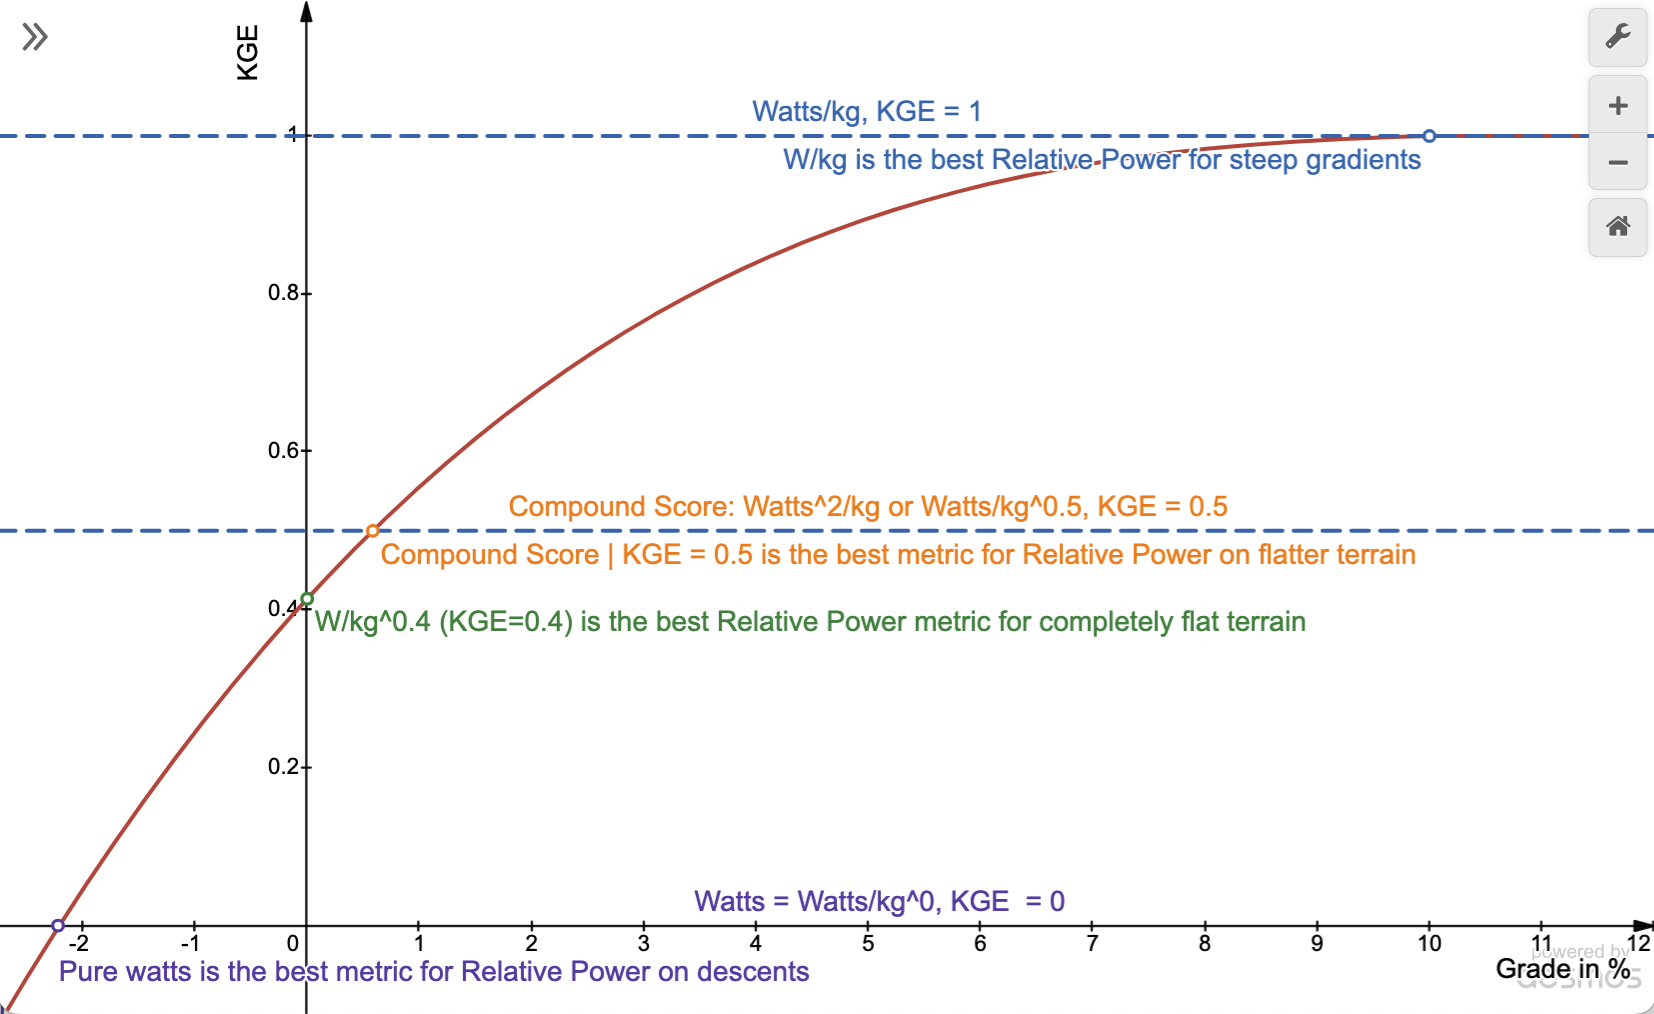
Reading this graph, you’ll note some key points along the curve. On flat terrain, the KGE is 0.4. This means that weight has less than half the impact that it has at 10% where KGE is 1. At -2.2%, weight has no bearing at all and KGE is 0. Where KGE is 0.5, i.e. the Compound Score, is where terrain is mostly flat, averaging under 1%. At this gradient, the effect of your weight is 50% that of W/kg.
Ok. So what does this all have to do with the price of bananas?
Using Xert Relative Power we can now solve a series of problems that has faced the cycling community when comparing data from one cyclist to another:
- Who’s likely to be faster for a given power output between Rider A at X kg and Rider B at Y kg? If we know the grade, we can estimate.
- How much power does Rider A at X kg need to produce to keep up with Rider B at Y kg? Again, if we know the grade, we can estimate.
- Who is the race course best suited for? If we take an average over time (not distance!) of the KGE, we can estimate what the requirement will be for the course and which athlete, A or B, is better suited. That’s pretty valuable for an athlete deciding on which event to target or for a team to select the appropriate riders for events.
- If Rider A and B are riding side-by-side and A is having to put out more relative power than Rider B, then Rider B is more efficient. Relative power can help us assess which of the two is more efficient, either due to better drafting, riding position, clothing, rolling resistance, bike CdA, drivetrain efficiency or some combination. If we keep everything constant except for better drafting. for example, we can estimate the wattage differences due to how well a rider manages their power during a race. That’s a pretty valuable way to assess a rider’s racecraft in staying in the draft compared to another. You could do the same analysis looking for differences in bike aerodynamics or rolling resistance, for example. Anytime you need to compare power data from two or more riders and you want to extract something meaningful in the data, using relative power can help in that assessment whereas power or w/kg may give you misleading results.
How We Calculate Xert Relative Power
Applying relative power generally using the formulas above is quite tricky, however. As you’re probably already thinking, what does a KGE of 0.4 on flat terrain mean? That’s:

This is some number that is less than using just watts but more than using watts/kg: A 70kg rider doing 200 watts on flat ground has a value of 200 / 70^0.4 = 36.6. The value 36.6 isn’t at all intuitive. To solve this problem, we go another step to make Xert Relative Power (XRP) something more tangible: we use a 75 kg athlete as the base weight and use the following formula.
Xert Relative Power:
^kge}")
This value is always in watts and translates to the power a 75 kg rider would have to produce to ride beside another rider weighing X kgs. Here’s an example. For a 85 kg rider doing 300W on a 2.5% grade, where the KGE = 0.7, their Xert Relative Power is:
^0.7~=~275~watts}")
What this means is that when an 85 kg rider is doing 300 watts on a 2.5% gradient, a 75 kg rider would have to do 275 watts to ride with them, all else equal.
Evaluating A Course for Rider Suitability using XRP
You can compare athletes for suitability for a particular course by evaluating their signature, weight, the course Focus and the course overall KGE. Let’s use an example to illustrate.
Here are two riders for a course that favours 4 minute power (Puncheur in Xert) with an overall average grade of 2.5%, i.e. average KGE = 0.7:
| Rider 1 | Rider 2 | |
|---|---|---|
| Threshold Power | 320 W | 280 W |
| High Intensity Energy | 28 kJ | 22 kJ |
| Peak Power | 1200 W | 1000 W |
| 4 Minute Power | 429 W | 366 W |
| Weight | 78 kg | 65 kg |
| FTP in W/kg | 320 / 78 = 4.1 W/kg | 280/65 = 4.3 W/kg |
| Grade | 2.5% | 2.5% |
| KGE | 0.7 | 0.7 |
| Xert Relative Power – 4 Minute Power | 429 * (75/78)^0.7 = 417.4 W | 366 * (75/65)^0.7 = 404.6 W |
| Xert Relative Power – FTP | 320 * (75/78)^0.7 = 311.3 W | 280 * (75/65)^0.7 = 309.5 W |
In this example, the heavier rider with the higher 4 minute power has an advantage of about 13 watts over the lighter rider on this course as well as a small advantage in FTP, even though with average grade of 2.5 (KGE of 0.7), this is a fairly hilly course and would likely initially be perceived as favouring the lighter rider with the higher FTP in W/kg.
Where is Xert Relative Power Used on the Xert Platform?
There are three main applications of XRP in Xert:
- XRP is used in Group Ride Analysis. You can compare the data between two riders of different weights that rode together on a group ride. Xert will take into account the gradient (thus the KGE) second-by-second in the ride to calculate the XRP for every rider in the group and allow you to compare them to one another.
- XRP is used in Race AI to transform the power from a data file that another rider performed to what the power would need to be for you at X kilograms body weight. This enables you to understand what the demands are for the race or event at your given body weight.
- XRP is displayed on our Xert Dashboard Garmin Datafield (coming soon!) as a rolling average. This allows you to compare your power data with another directly, accounting for differences in weight and gradient.
XRP in Group Ride Analysis
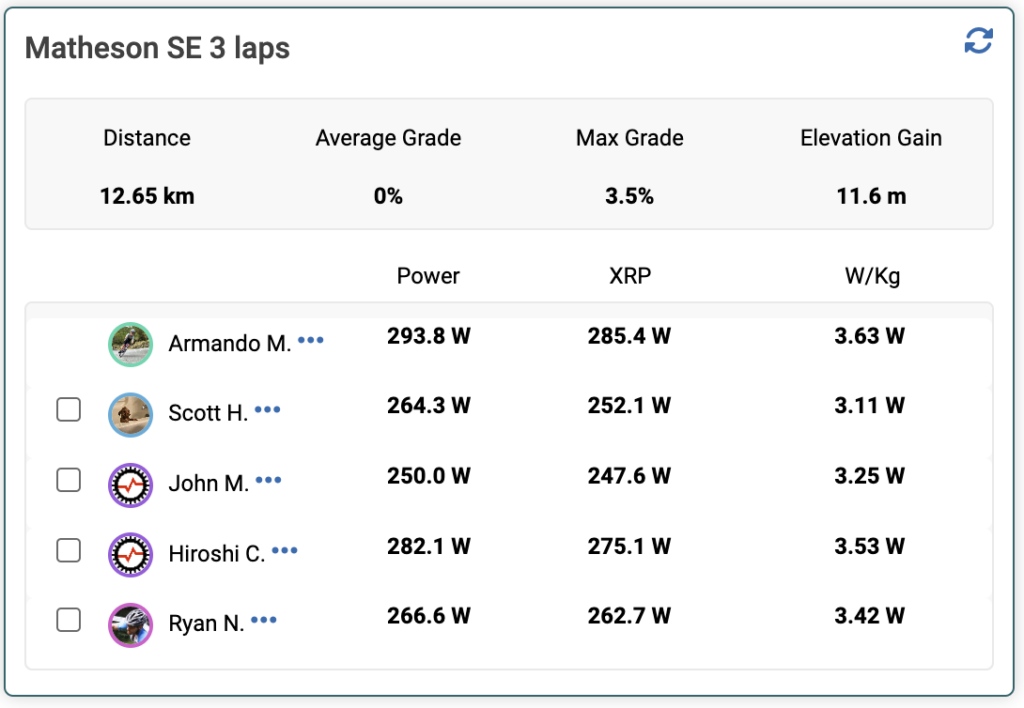
When you complete a group ride with other Xert users and your data is shared, you can compare your average XRP for any part of the ride where you rode together. This comparison can help you understand one or more of the following:
- Who pulled more? XRP could be higher for those that pulled more and did more work at the front than other riders. Maybe point that out and offer a compliment.
- Who didn’t pull enough? XRP could be lower for those that stayed in the pack more than others. In a race, this is a good thing.
- Is my power meter acting up? If your power data is significantly different than others and you feel you rode no differently than they did, it could mean your power meter isn’t properly calibrated and/or could be inaccurate. If you get a breakthrough and didn’t feel like you worked that hard, a quick inspection of your XRP as compared to others might reveal that your power meter data isn’t accurate.
- That new aero bike in the group is fast! If someone in the group has lower XRP data compared to you than they did before, it could be that new aero bike or wheels or kit they have. Maybe another in the group had a flappy jacket on and their numbers were considerably higher. (Keep that to yourself and just make sure to give them kudos and comment on how strong they rode.)
XRP in Race AI
XRP is a key component of the Race AI feature where you can use data from other riders to assess your ability to produce similar XRP based on a comparison of their weight and the course terrain and your goal weight. There are some key things to keep in mind when you consider what Xert is doing when computing your power requirements:
- If the terrain is mountainous, a reduction in your target weight is going to have a significant impact on the power you will need to produce.
- If the terrain is flat, a reduction in target weight will not affect the power requirements as much.
- A reduction in body weight can impact your signature. Dieting can reduce muscle mass and thus lower your fitness signature. Depending on the course profile and how the race will be performed will provide feedback as to whether weight loss may or may not be advantageous.
| Race AI Example 1 | Race AI Example 2 |
|---|---|
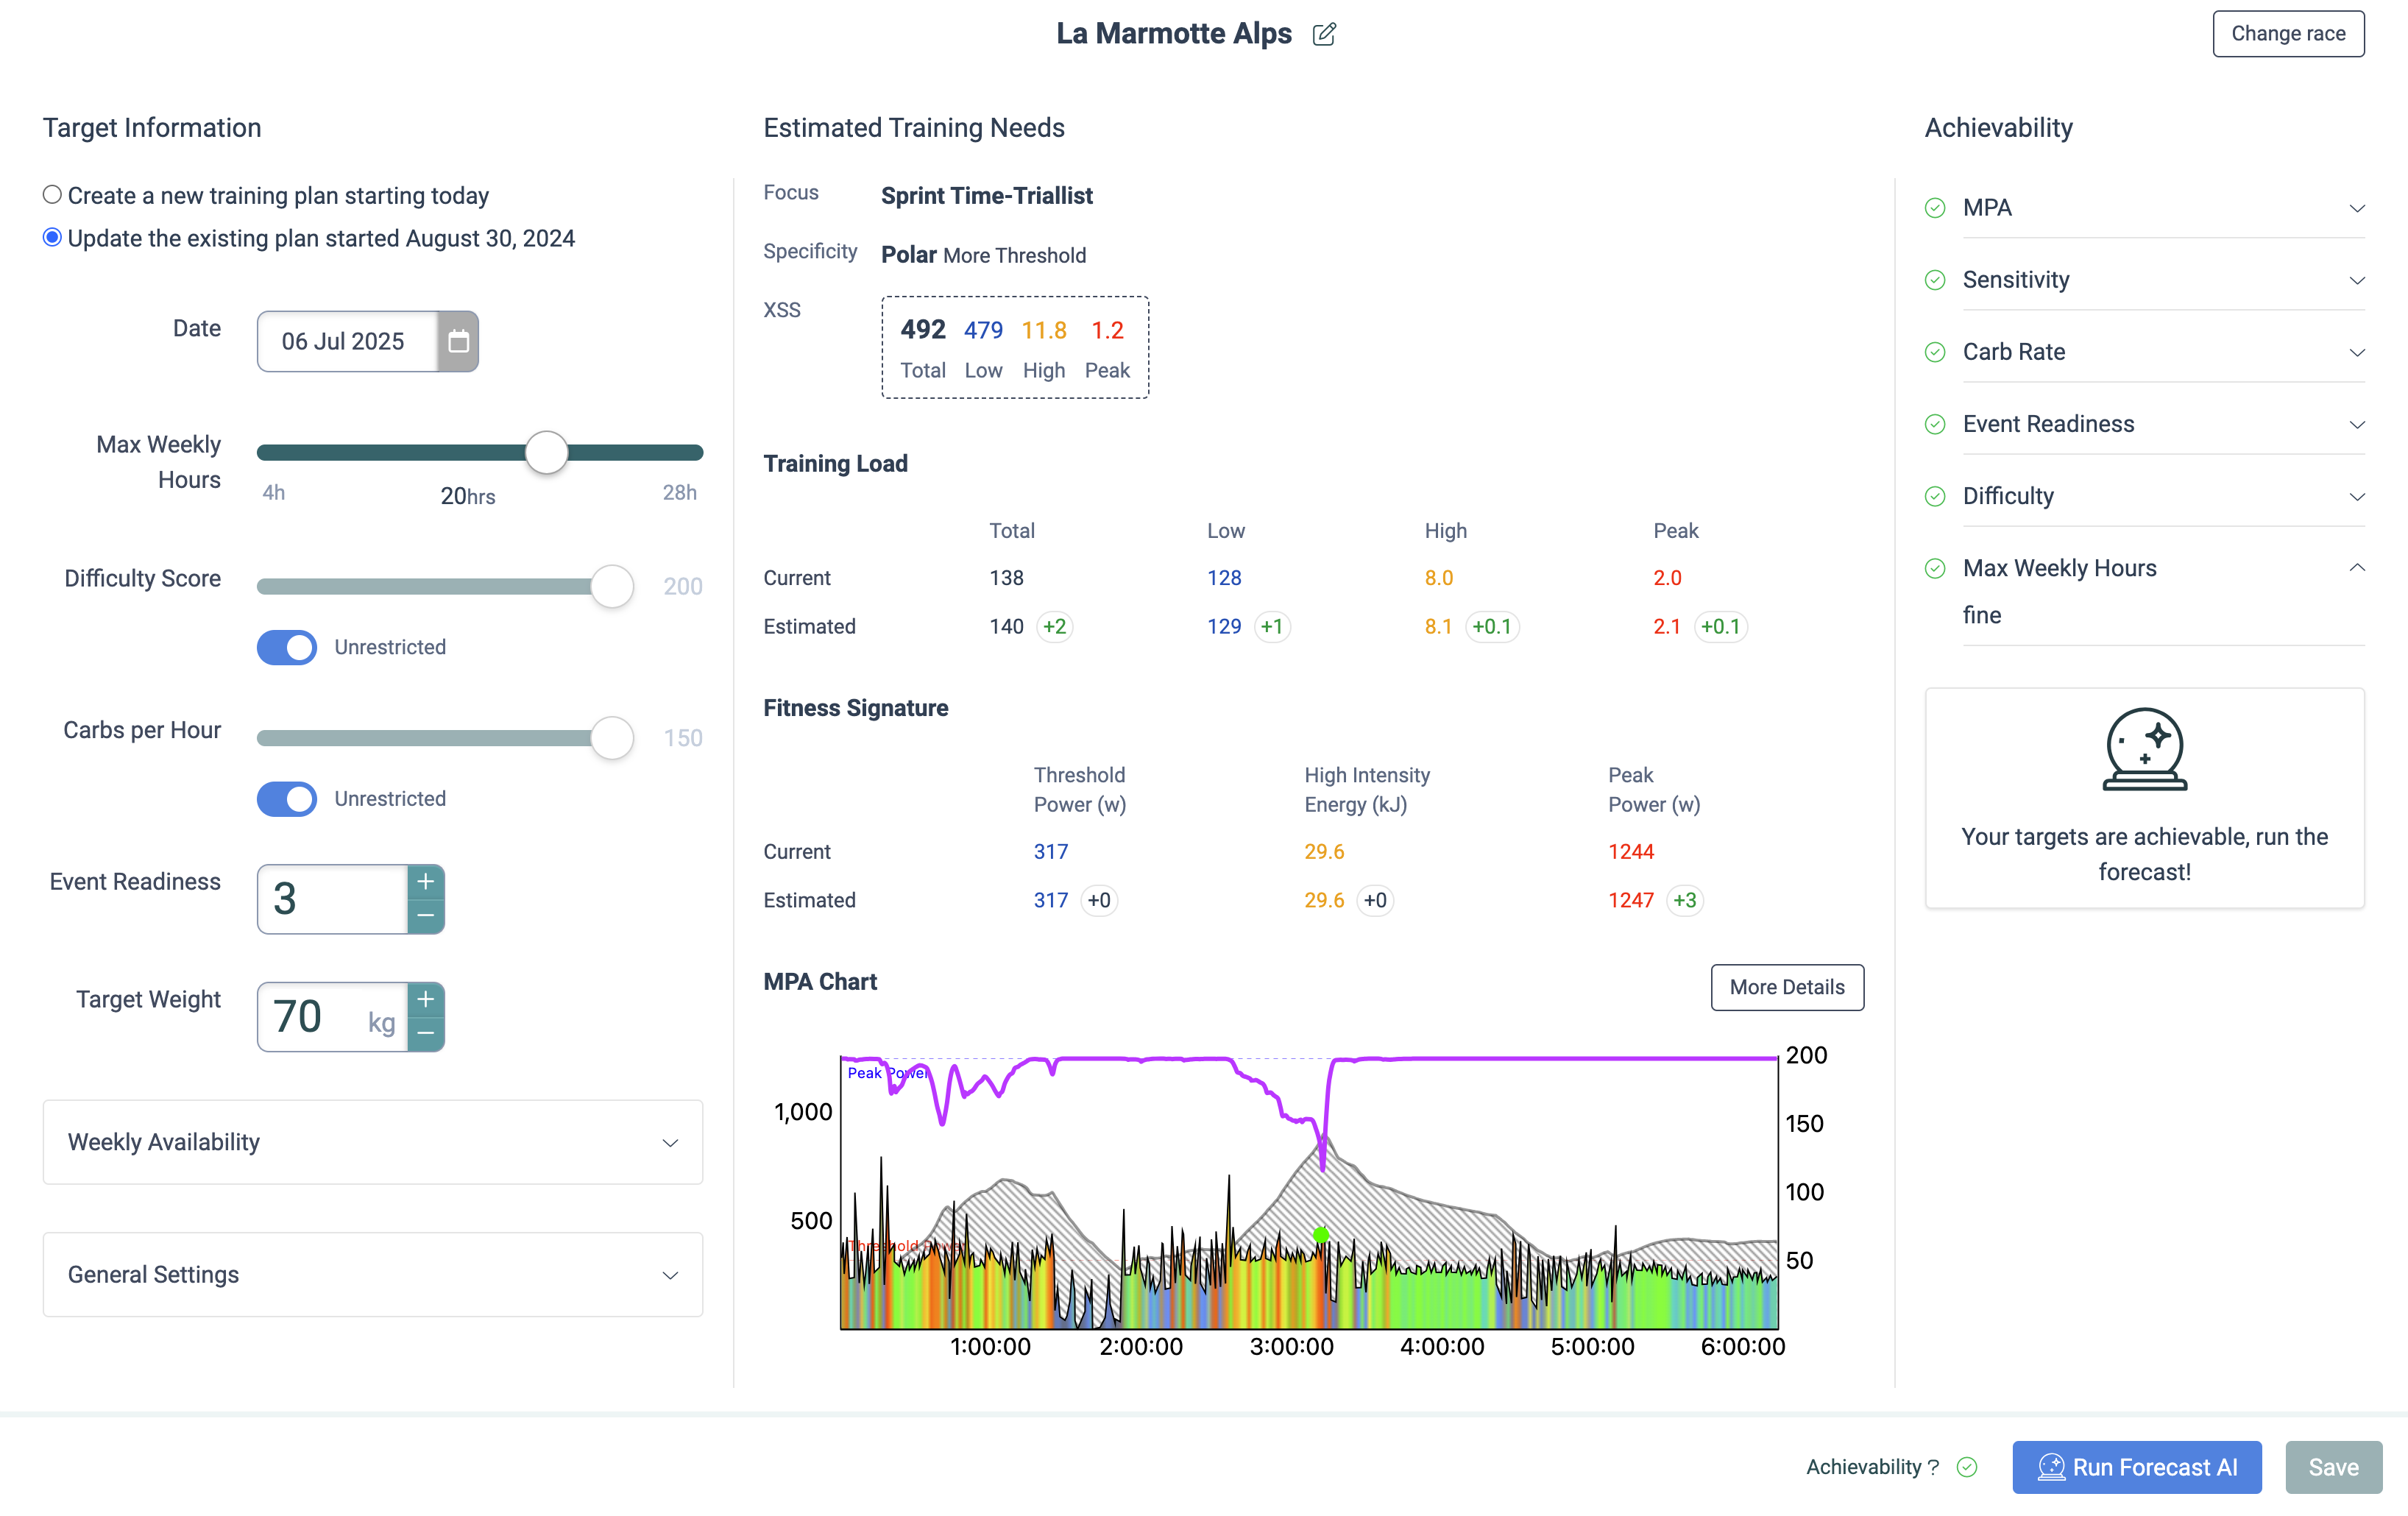 |
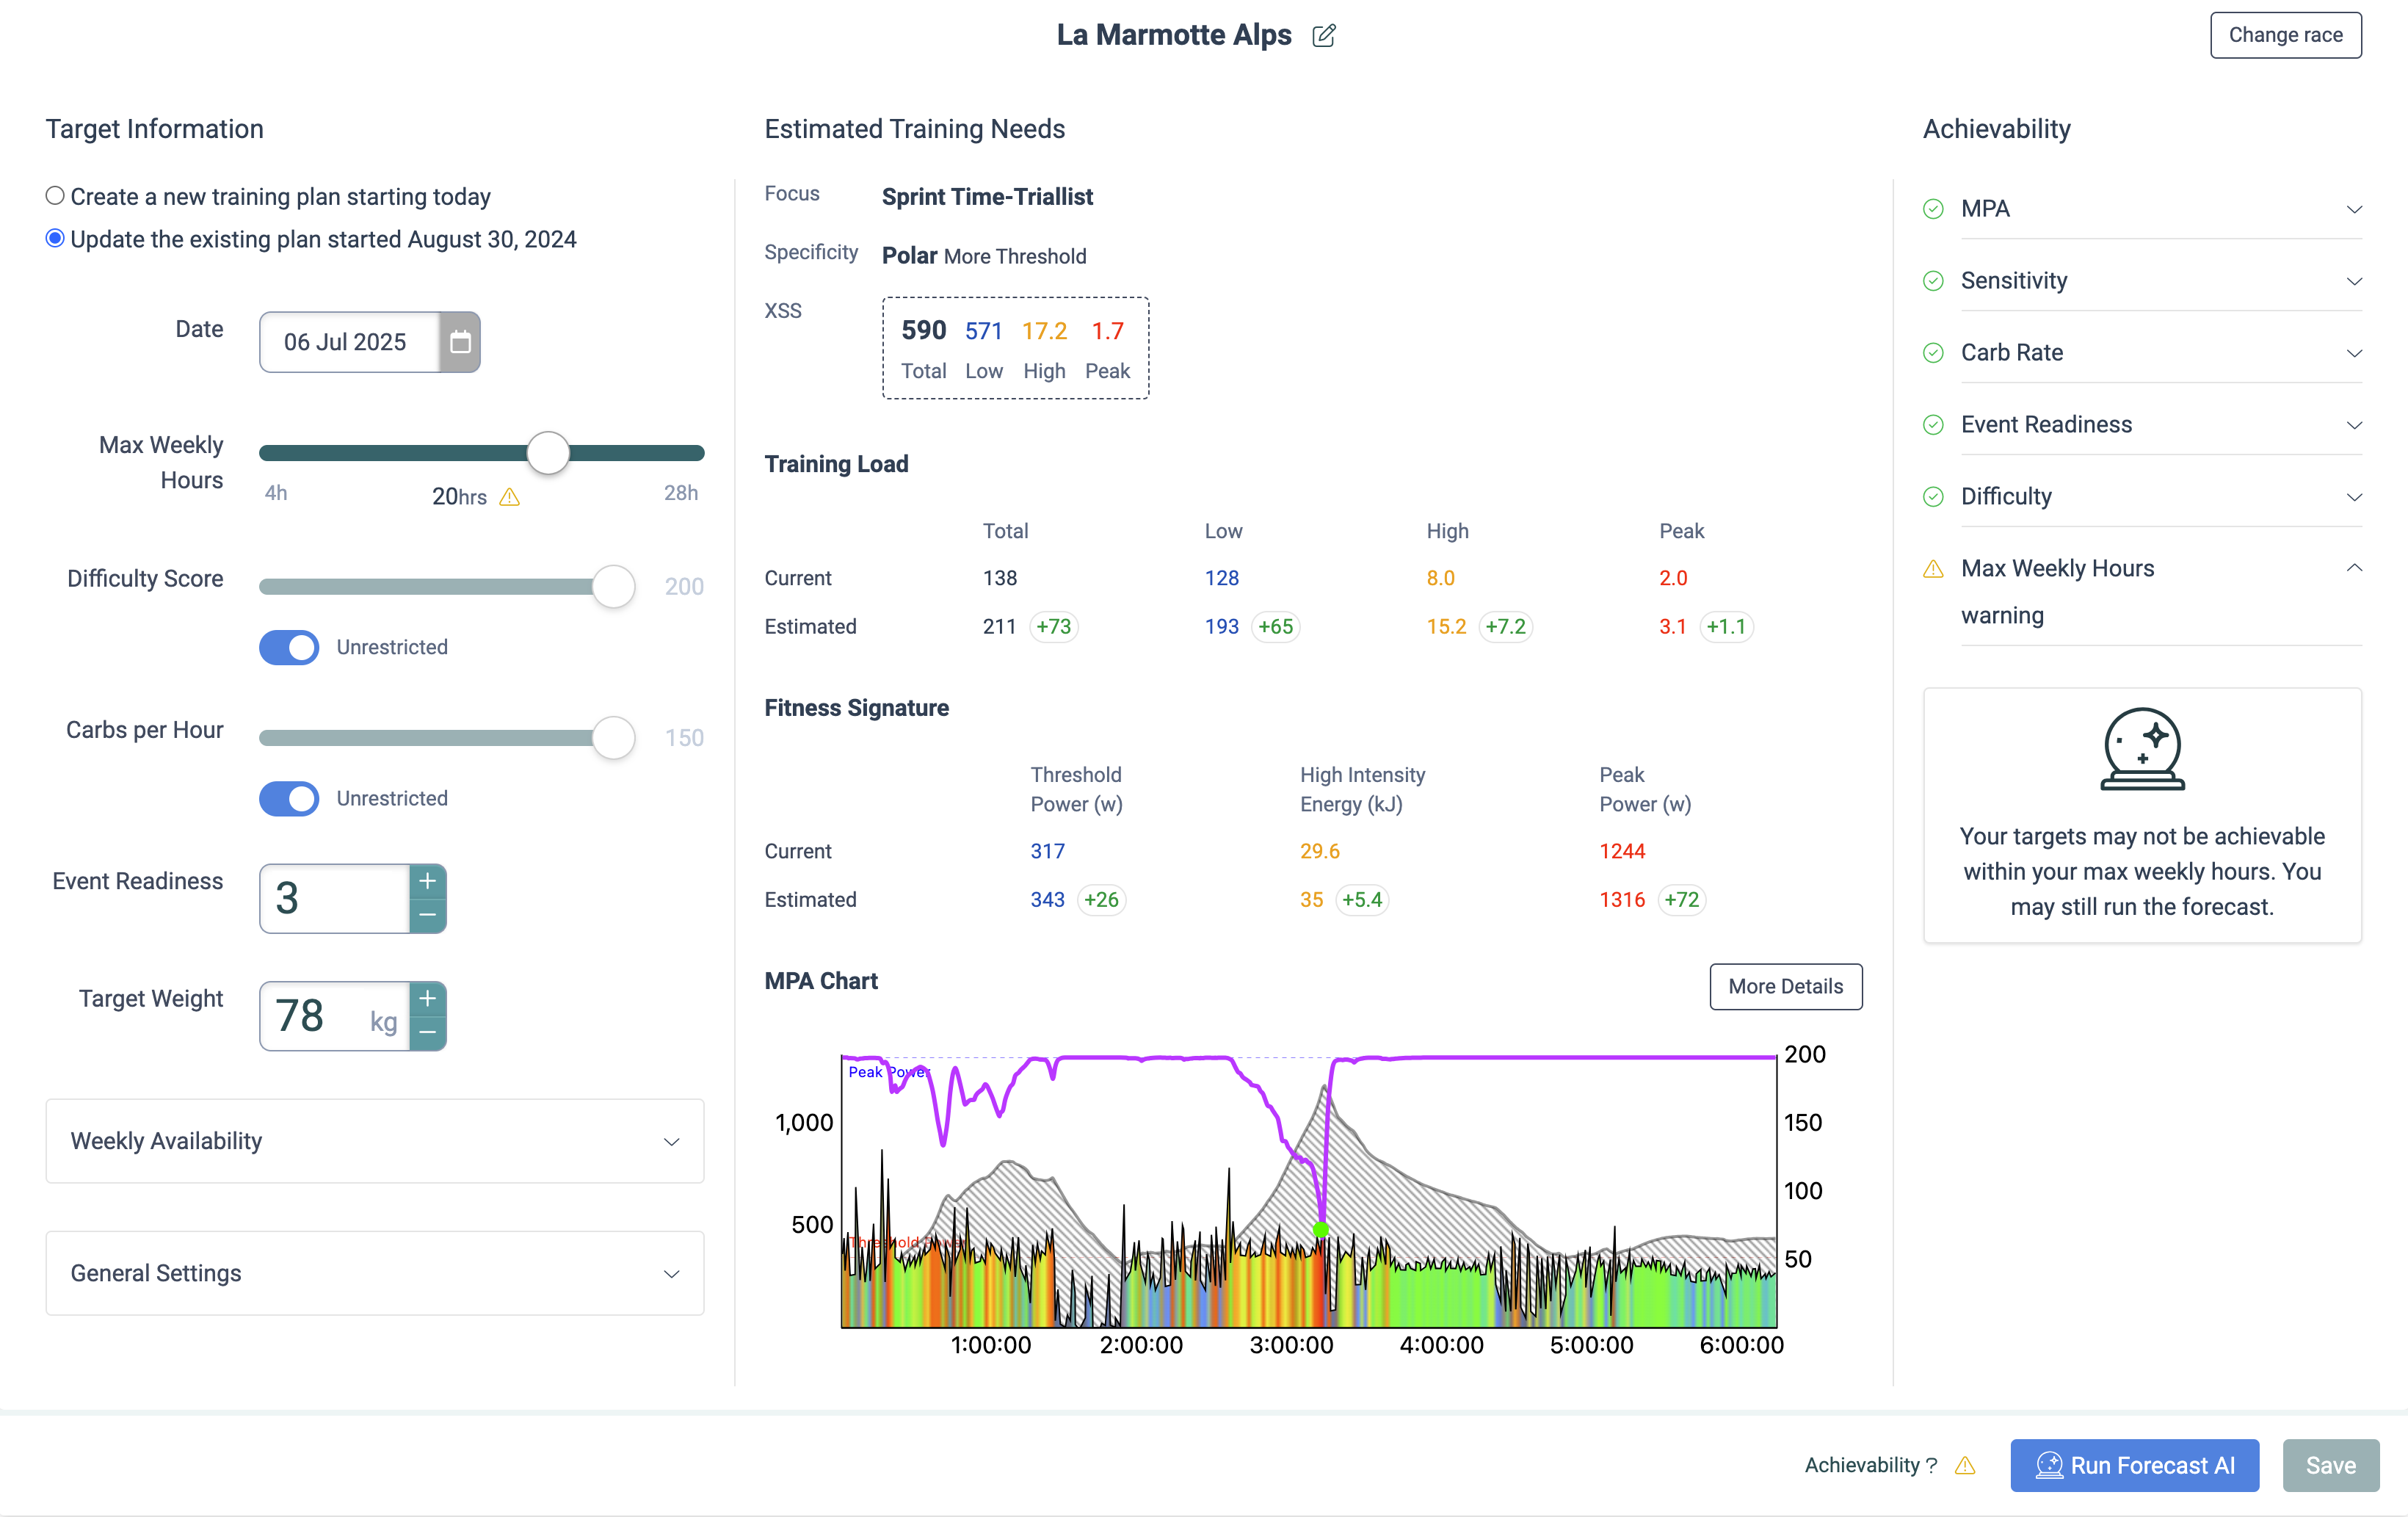 |
| The chart above shows the power requirements and associated MPA for the La Marmotte Alps for a cyclist that weighs 70kg. The signature needed to complete the race within the given constraints is almost exactly the same as their current fitness signature. The average power (under More Details button) is 222 watts for this event. | But with an increase in weight of 8kgs (18 lbs) to 78 kg, this has a significant increase in relative power and thus the raw power needed. The same goals become very challenging if not impossible given the weekly time commitment. The average power increased 21 watts to 243 watts. |
XRP on the Xert Dashboard Garmin Datafield in Real-Time
Having XRP displayed in real-time is useful in enabling a variety of capabilities that are more difficult to do with power data alone:
- If you’ve ever asked the person beside you how much power they are putting out in order to compare with your own, using XRP helps eliminate the differences due to weight and gradient. You can be more assured that you’re comparing “apples-to-apples” when they give you their XRP number rather than their power number.
- You can agree on a more even pace for a group ride. Setting watts or W/kg targets for a group ride can lead to mismatched power on hills or flatter roads, respectively. Using XRP instead helps even things out.
- You can target an intensity for team tactics during a race. This can be particularly useful on flatter ground where the larger/smaller individual team members may be required to hold an intensity for tactical purposes. XRP can be used more universally as a target for various members of the team independent of their size or the terrain.
Understanding Key Concepts – Less is More
Athletes and coaches all understand that if you can produce more power, that’s a good sign. More power = stronger rider, as we saw in the example above where we compared the values of two riders for a particular course. But when it comes to comparing XRP from a ride using data from two or more athletes, less power is better. This is because less XRP compared to another rider during a ride means you are using less energy to achieve the same pace and speed as another rider. The lower XRP means you have one or more of the following advantages:
- You stay out of the wind better than others.
- You have a better riding position on the bike.
- You have a better fitting and aero kit.
- You have a bike that’s more aero.
- Your drive-train is more efficient.
- You have tires with better rolling resistance.
- You have better racing/riding skills and need less energy to maintain your speed.
If you compare raw power data, you’ll miss the impact of weight and gradient in the calculations and can misinterpret the results. With XRP, you can examine the data more readily and infer which of these might explain the differences in power between two riders. You can then look to address these differences.
What does it mean if my XRP is Too Low or Too High as Compared to Others?
It’s important that you gather and compare quality and accurate data first and foremost. In addition, you should ensure that each person that’s being compared has a proper weight associated with their corresponding activity. If your data appears to be too low compared to other riders:
- Your weight might be set too high. Maybe the diet has kicked in?
- Their weight might be set too low. They don’t realize the treats at the coffee stop are having an effect? (Sshh.. don’t tell them.)
- Maybe your power meter might be reading too low. Check calibration, battery levels, L/R balance changes if using a single-side power meter.
- Their power meter might be reading too high.
- You spent more time at the front of the group than others.
Vice versa, if your XRP is much higher than the other riders:
- Your weight might be set too low. Time to lay off the pizza?
- Their weight might be set too high. They’re keeping secrets from you.
- Maybe your power meter might be reading too high. Check calibration, battery levels, L/R balance changes if using a single-side power meter.
- Their power meters might be reading too low.
- You spent very little time at the front of the group compared to others.
Understanding XRP in Virtual Cycling
Platforms like Zwift and Rouvy, have their own weight, gravity, aero, rolling resistance and drafting physics models and are likely to resemble the XRP modeling that we use in Xert when riders are riding in the virtual world. You can compare a group virtual ride in Xert and you can draw similar conclusions about your racing abilities and/or equipment choices, but importantly your data won’t be skewed high or low or will have power meters errors that are detectable. This is because they are using your power data and your weight setting to adjust your speed at every point in the ride. It’s presumed to be accurate.