Xert’s Multi-Dimensional Performance and Training Model
About 7 years ago, we were the first to introduce a multi-dimensional Impulse-Response Model. We brought in Xert Strain Score, i.e. XSS and the 3 dimensional XPMC. Since then, Xert has been helping athletes quantify their training in unique and powerful ways.
Over the course of these last 7 years, we’ve acquired quite a bit of understanding about performance and training. We’ve come to recognize how these models represent deeper aspects of fitness that we didn’t initially realize. We also learned about some drawbacks that needed to be addressed. In the course of analyzing thousands and thousands of athletes and their data, we saw opportunities to improve how the system manages this data. We then saw how we could use this new found knowledge to further optimize training prescription.
Understanding How Impulse-Response Models Work
Before we get into the details, let’s lay some groundwork for the concepts that we’ll be exploring in this universe. Whether it’s called a Performance Management Chart (PMC), a Freshness-and-Fitness Chart or an Xert Progression Management Chart (XPMC), they all follow the foundational principles that are part of Banister’s original Impulse-Response Model for exercise and use the concepts presented below:
Concept |
Basic |
Detailed |
| Training Load TL Chronic Training Load CTL Fitness |
This is calculated as your average daily XSS over an extended period. It takes many weeks to build it up and many weeks for it to go back down.
A TL of 75 means you’ve been doing on average 75 XSS every day over the past few weeks/months. Training Status is based on this number.
|
Training Load (TL) is synonymous with Chronic Training Load or Fitness used on other systems. TL is a measure of the average XSS you get daily, exponentially-weighted. The key aspect of it is that it’s a weighted average which means that yesterday’s XSS is more important to the calculation than the day before yesterday, which is more important to the day before that, and so on. What you did three months ago isn’t going to make a big difference to your average. But what you did over the past week or two is going to have a big impact on this average. This is how exponentially-weighted moving averages (EWMA) works. This should make total intuitive sense. The training you do doesn’t last forever and the amount you’ve been accumulating over the past few weeks and months on average has the greatest impact on your performance.
How important the training you did last week to what it is today depends on the time constant. The time constant is important since if it’s a big value, training load takes a long time to build up and a long time to decline. If it’s a smaller value, your training load increases more quickly but also declines more quickly too. Training Load influences two main aspects of your fitness: a) your fitness signature, which translates into the power you can produce over various durations and b) how much training you can handle, which translates into how big of a ride (in XSS) you can handle. |
| Recovery Load RL Acute Training Load ATL Fatigue |
This is calculated as the average daily XSS you’ve been doing very recently. It goes up and down much faster than TL does.
For example, when you do a really big ride with a lot of XSS, RL goes up a lot whereas TL will go up a little.
|
Recovery Load (RL) is synonymous with Acute Training Load or Fatigue used on other systems. Like TL, RL is also a measure of the average XSS you get daily. The main difference between RL and TL is that RL doesn’t last as long. It’s still weighted like TL, but rather than looking at training you did weeks/months ago, RL is more influenced by what you did days ago. The amount of recovery you need from something a few weeks ago is not as important as the recovery you need from something you did yesterday. Conceptually, both RL and TL are EWMA values but RL simply increases and decreases much faster. This means the amount of recovery you need from a ride or workout you do decreases quickly. This is what enables you to do another ride or workout a day or two after your last but still improve.
RL has these properties because time constant is less than your TL time constant. This allows the fatigue (RL) to dissipate faster than your loss in fitness (TL). |
| Form | This is the difference between your TL and your RL: TL – RL. Form is a relative number. When it’s negative, RL > TL so your recent training is more than you’ve accumulated over an extended period of training. When Form is positive, your recent training is less than your extended period of training.
Seems a bit counterintuitive to think that more recent training means negative Form but this is because if you do too much more, you’ll have much more fatigue and it will affect your performance, i.e. be a negative on your ability to perform. Something to remember: If TL is a big number, RL can be a big number too before Form becomes a negative number. The physiology of this is intuitive: as you slowly increase your training over time, the more training you can do every day. Your body recovers faster as your training increases. Pretty cool. Form is used in Xert to determine your Training Status colour and is also used to quantify readiness-to-train.
|
Even though both TL and RL represent daily XSS averages, because RL has a shorter time constant than TL, your Form after a ride or workout goes down but then goes back up a day or two later due to this difference. Form first decreases right after your ride but then starts to increase until you do the next one. |
| Recovery | This is the amount of time it takes for Form to return to a specific value. Generally, the more you’ve done recently (RL) compared to what you’ve been doing over the past few weeks/months (TL), the longer it takes to recover.
Example: If you’ve been riding 100 XSS a day, every day for a few months, your TL will be 100 and your RL will be 100 as well since you do the same thing every day. Form is zero each day. But if one day you do 300 XSS, your TL may go up a little but your RL goes up a lot. This makes Form become a very negative number. It’ll take a day or more of recovery before your Form goes back to zero where it was before the big ride. This is the recovery time you will need due to the big increase in training you performed. |
Progressive overload introduces recovery time. Based on respective time constants and the increase in XSS you do, determines how much recovery time you will need. The greater the amount of XSS you do relative to your TL, i.e. the higher the Ramp Rate, the more recovery time needed. |
| Improvement Rate IR Ramp Rate RR |
Improvement Rate is Xert’s way of helping you understand Ramp Rate. Ramp Rate is how fast TL increases on a per-week basis. So if Ramp Rate is 2, your TL is increasing by 2 points every week.
TL increases slowly in general. To get a higher Ramp Rate means you need to be doing a lot more XSS than what you typically do in order to get it to increase. So a Ramp Rate of 7 (Extreme-2) requires a lot of additional training to do than a Ramp Rate of 1 (Slow). The higher the Ramp Rate also means your RL will increase even more. This increases the recovery time you’ll need. In terms of overtraining, TL, RL and Form help shed light on when you might be overdoing it. You can only increase your TL so much before your RL and Form will indicate you need to recover. Ignoring these signs may result in overtraining.
|
Your highest Ramp Rate, i.e. what rate of increase is sustainable, depends on how RL increases and thus the comparative TL and RL time constants. The recovery an athlete requires increases as the Ramp Rate increases. This can be done by having recovery days when Form is below a threshold, or accumulating even more fatigue and waiting, then introducing more recovery time. Accumulating more fatigue before recovering is referred to as over-reaching but can be difficult to manage and often is what leads to over-training if not closely monitored. |

The 4 Main Issues with Traditional Impulse Response Models
Impulse-Response models are remarkably robust. Despite the many drawbacks highlighted below, they work astonishingly well in a great many situations, underscoring how our bodies actually adapt according to these natural mathematical principles.
- Scores/Training Stress
- The main challenge with every Impulse-Response model is how to quantify training loads or training stress, particularly if it’s a single-dimensional model. Quantifying how much of the exercise should be counted towards the accumulation of training load is the biggest challenge. Many metrics have been used and proposed over the years, many based on heart-rate or average power but they often oversimplify the training stress and ultimately make the calculation of training loads less meaningful. Despite these rougher training stress measurements, Impulse-Response models are still a foundational part of all training prescription.
- Single Dimensional
- All training stress isn’t the same and can affect performance in different ways. For example, repeated sprinting for 20s has a very different effect than repeated jogging for 20s. Sprinting for 200 metres is different that jogging for 200 metres. Sprinting to burn 20 kilojoules is different than jogging for 20 kilojoules. Sprinting for 10 TSS isn’t the same as jogging for 10 TSS. Simply put, saying “sprinting” should be put in the same bucket as “jogging” is a mistake, even though both are the same activity – running. Training intensities affect different systems in different ways so using a single dimension to measure training stress will simply never fully represent training stress.
- Feedback needed
- Impulse-Response models are used to predict performance but what performance are they trying to predict? What does performance mean? For many sports such as running, it’s pretty simple: you take an athlete’s performance in races. If the athlete only has a couple of races per year though, then you might need additional tests. For cycling, it’s a harder problem since races don’t always push the rider to perform at their very best. Even when they do push and reach their limit during a race, a highest mean-maximal power calculation (i.e. maximum 20 minute power, for example) isn’t always in the data. Lab testing is often needed and if the athlete is too busy racing, you may not get enough tests in to identify the pattern between training load and performance necessary for the proper application of the Impulse-Response model.
- Form goes too high
- A problem we’ve discovered here at Xert, is that value for Form can misrepresent that athlete’s readiness-to-train. Let’s use a simple example to illustrate. Say an athlete has a TL of 50 and RL of 50 and they train 50 XSS daily. The 50 TL is essentially homeostatic, with Form returning to zero everyday. This requires no recovery since the daily XSS is their average daily and they can do this everyday, by definition. If one day the athlete happens to miss a day, the following day they would expect to be able to do ~100 XSS to return to homeostasis. If they missed 2 days, ~150 XSS .. and so on. RL continues to decrease every day. But a single bout of 150 XSS isn’t going to bring the athlete to homeostasis, even if Form indicates it is. The athlete will require some rest because all they have ever done is 50 XSS. 150 XSS is a big disruption to this homeostasis. Since Form is a measure of readiness-to-train, then it can’t become too positive suggesting the athlete has extra readiness to do a lot more. That simply isn’t true. At some point the theory behind what’s possible in the Impulse-Response model using the regular calculation of Form will break down and misrepresent the athlete’s true Form.
How Xert Addresses the 4 Main Issues
Xert’s MPA to the Rescue
The discovery of the math behind MPA has led to more than just discovering what your FTP is and giving you fitness breakthroughs. It’s gone far further than this and has helped shed light on how training stress and strain affect training loads and performance. Your fitness signature is used to calculate MPA. How close you perform to your MPA, as it changes during the course of your workout/ride, is how we calculate strain. Unlike other measures, this isn’t some average value or value that isn’t visible in heart-rate data (since heart-rate doesn’t reflect short, very high intensity efforts, for example). MPA allows the ability to derive strain second-by-second. This addresses the first issue: 1. Score/Training Stress.
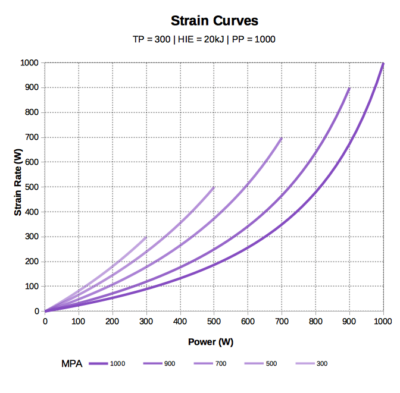
Your fitness signature helps quantify which proportions each fitness signature parameter contributes to the strain associated with the current effort during a ride. With 3 parameters: Threshold Power, High Intensity Energy and Peak Power, we can determine which of the three is being affected by strain. That is, we can take a strain value and divide it up into Low, High and Peak systems, each corresponding to Threshold Power, High Intensity Energy and Peak Power, respectively. Here we resolve the single dimensional problem 2. Single Dimensional and use 3 dimensions instead.
Breakthroughs are fun. But they are hard to get, sometimes almost impossible. But you get them far more often than those times you get a new 20 minute best power for example. You may never get a new 20 minute best power in an entire season. Xert’s fitness breakthroughs are the foundation of how we solve 3. Feedback Needed, rather than rely on lab testing, we can rely on day-to-day maximal efforts that most athletes have within their data. Indeed, achieving fitness breakthroughs not only informs the model on how you’ve been progressing, but they are fun, part of racing and improve your fitness all at the same time. An interesting phenomenon that we’ve discovered in Xert is the degree to which you express an aspect of your fitness is the same as the amount of strain you apply on it. That’s profound.

Improving Readiness-to-Train
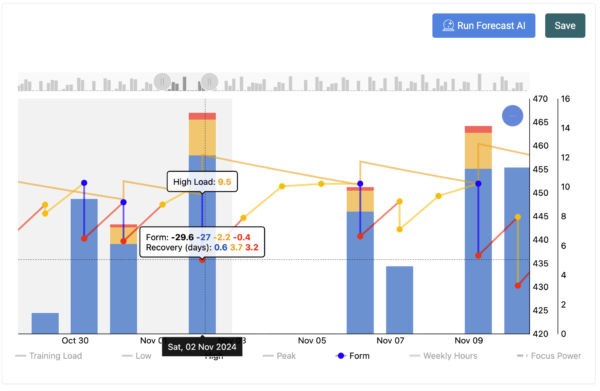
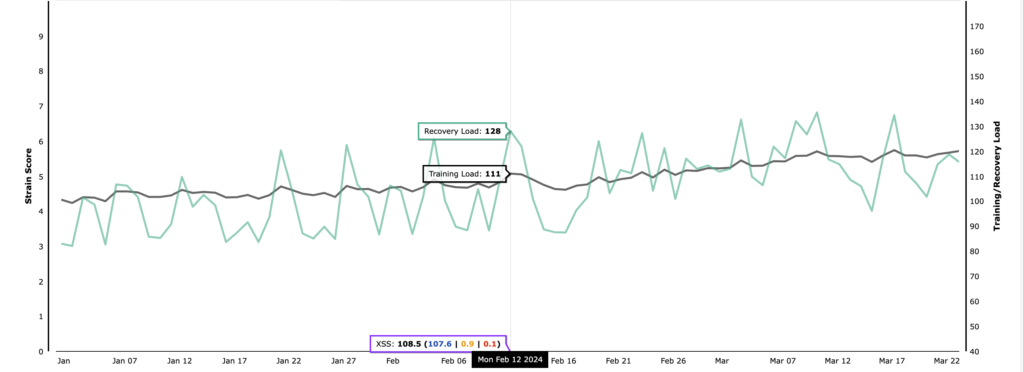
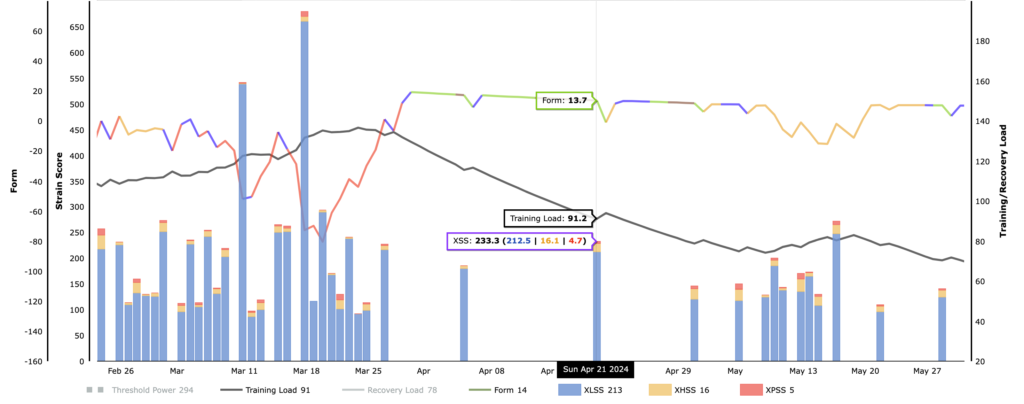
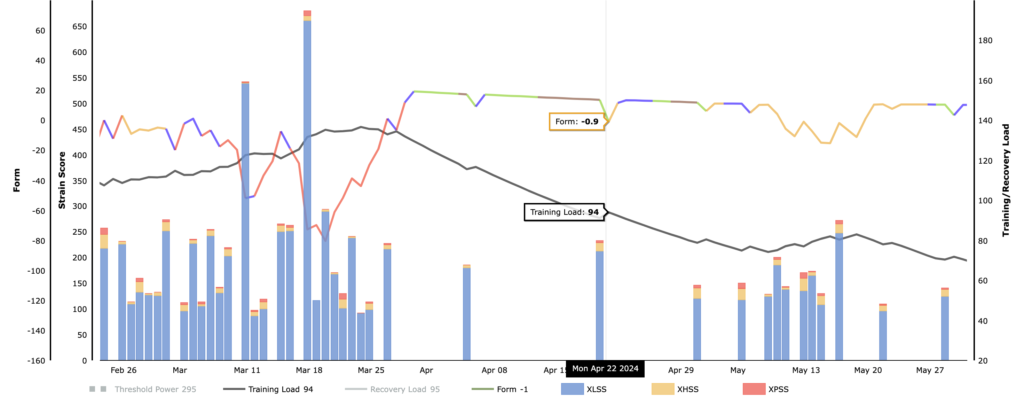
Addressing the fourth issue above: 4. Form goes too high, requires rethinking the Impulse-Response model fundamentals. If we are looking to use day-to-day Form as a way to assess an athlete’s readiness-to-train, i.e. establishing a Tired or Very tired training status for example, then we’ll need to prevent Form from going too high. This is the same as preventing RL from continuously decreasing. We should cap RL to a more realistic value. If an athlete has a TL of say, 100 then, in principle, 100 is their homeostatic Training Load and Recovery Load should return to 100 minimum whenever an activity with 100 XSS is performed. RL should not decline more than what is required to return to zero form after an average day. We recently introduced this updated calculation of RL and is clearly visible on your XPMC during periods of longer time between activities. The consequence of this change is that you won’t see consecutive, high-volume training days with positive form. From a planning perspective, you are not likely to feel overtrained returning from a few days off following Xert’s guidance.
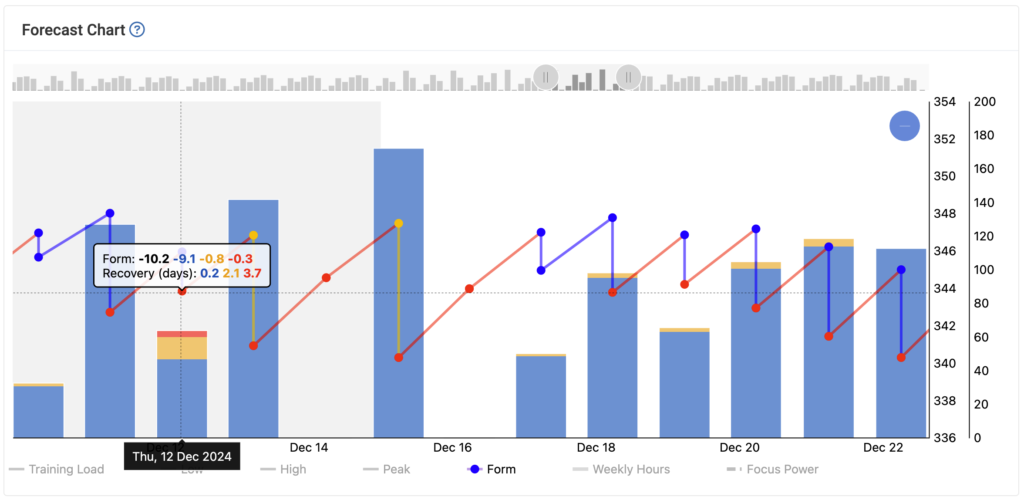
 |
 |
|---|
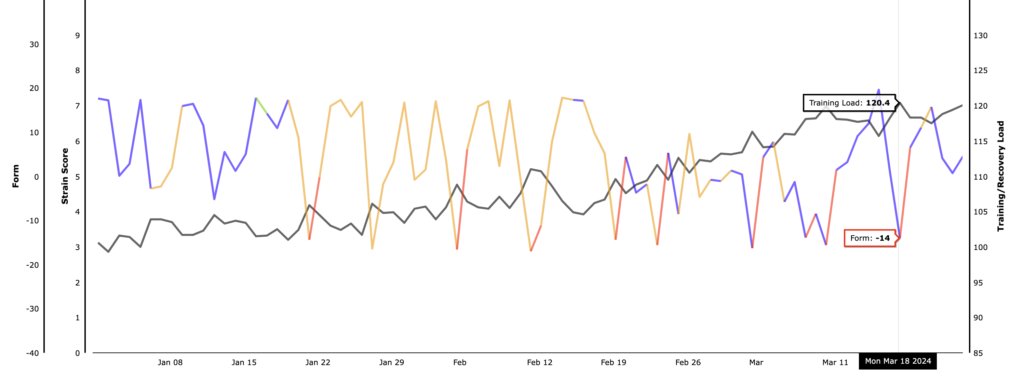
Form goes negative immediately after a big ride since Form (i.e. freshness, readiness-to-train) is capped before the ride.
Things That Live in this Multi-Dimensional Impulse-Response Space
As you might envision, managing the data from thousands of activities and examining second-by-second XSS/strain data using your fitness signature at that time, power and MPA, then subdividing each second’s strain into Low, High and Peak XSS that then feeds each into a corresponding and different Impulse-Response model, to calculate TL, RL and Form values for each system every second is a computationally challenging effort. But Xert does precisely this. In fact, once you have all this set up and tuned for a given athlete, a whole new universe of applications and actionable information become apparent and useful, both in predicting outcomes but also in optimizing a training program. Let’s dig into this.
Here are various aspects of training and performance many of you may be aware of that live in this multi-dimensional space:
Concept |
Explanation |
||
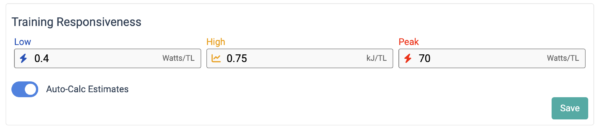
| Fitness and Performance | Having addressed all the main drawbacks of using an Impulse-Response model, we can correlate training loads with performance far more precisely and reliably. We define performance as what your fitness signature parameter was at a given time. This makes sense since your fitness breakthroughs express the changes in each of your fitness signature parameters. By going back historically, we can see where your fitness (Low, High or Peak Training Loads ) was at a given point in time and what your corresponding Threshold Power, High Intensity Energy and Peak Power were at that time and calculate how changes in your Training Loads affect each parameter. Xert does this for you and updates this relationship with each breakthrough processed. The results end up computing your Training Responsiveness coefficients that you see in your Profile Settings:
|
||
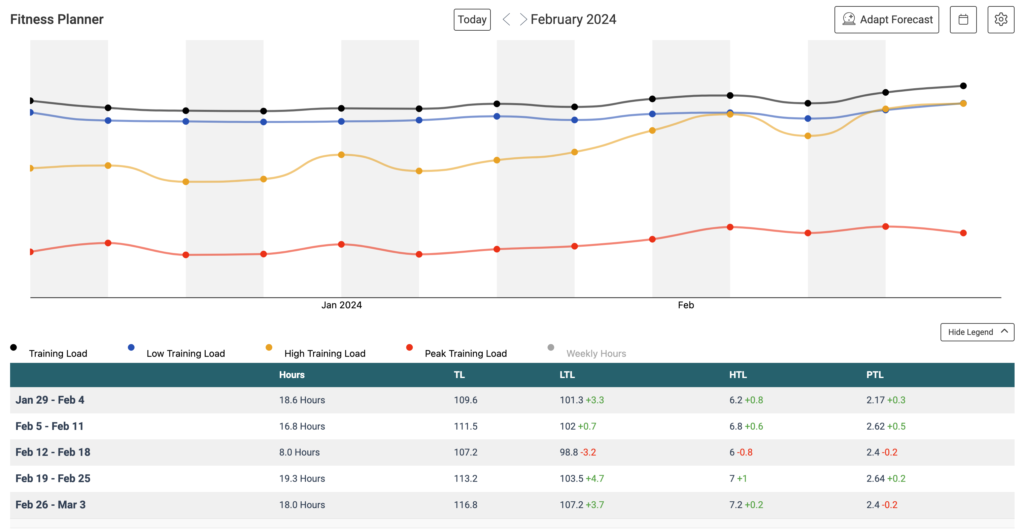
| Low/High/Peak Training Loads | In the course of a season, you will be doing various amounts of high-intensity training and your Low, High and Peak Training Loads will vary. Sometimes you spend more time doing base/Zone 2 and your Low Training Load goes up while High and Peak may go down, for example. Other times, you may be doing short Zwift races perhaps, and accumulate more High and Peak Training Load and see Low Training Load decline. How each of your Low, High and Peak Training Loads move up and down reflects the type of training you’ve been doing. You can evaluate where your Low, High and Peak Training Loads were at various points in the season. It becomes readily visible that those times when you were performing well at specific types of rides and events, were those times when you were well-trained for them. Training Loads reflect what kind of riding you had been focused on and also reflect what type of riding you were good at. These are often one and the same.
|
||
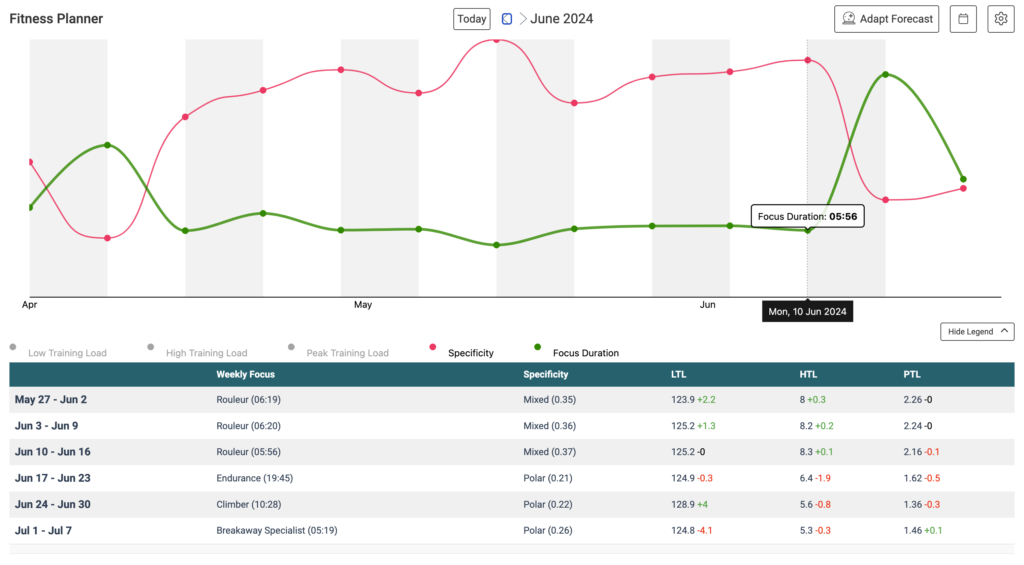
| Focus and Specificity | Similar to being able to review Low, High and Peak Training Loads, you can also interpret these as a Focus with an associated Specificity. If you’ve been preparing for a major event in the Dolomites, you’d be training using long efforts around Threshold Power and accumulating mostly Low and High Training Loads. You’d have few training rides that increase your Peak Training Load. From an Xert Athlete Type standpoint, your Training Loads would have a more Climber Focus, i.e. a long duration Focus as would be appropriate for longer mountainous riding. The ratios of your Low, High and Peak Training Loads reflect your training at a particular Focus Duration and Specificity. This helps to better interpret what the relative effect Low, High and Peak Training Loads have on your performance.
|
||
| Readiness-to-Train | Each system has its own TL, RL and Form values and we can use these values to establish a readiness-to-train. One system may have a large negative value and requires recovery whereas another might have positive form and is ready for training. Readiness-to-train now becomes a multi-dimensional number whereby you may need recovery in one dimension whilst being able to train another. This is a unique aspect that can be used to identify the type of training that’s appropriate at a given point in time. For example, if your High and Peak systems have a negative form from recent high-intensity rides but your Low system is still fresh with a positive form, then you can continue to ride but at an Endurance pace. Xert does precisely this when it comes to identifying your readiness-to-train for High/Peak intensity workouts (Fresh/blue Training Status), readiness-to-train for Low intensity only (Tired/yellow Training Status) and full recovery needed (Very tired/red Training Status).
|
||
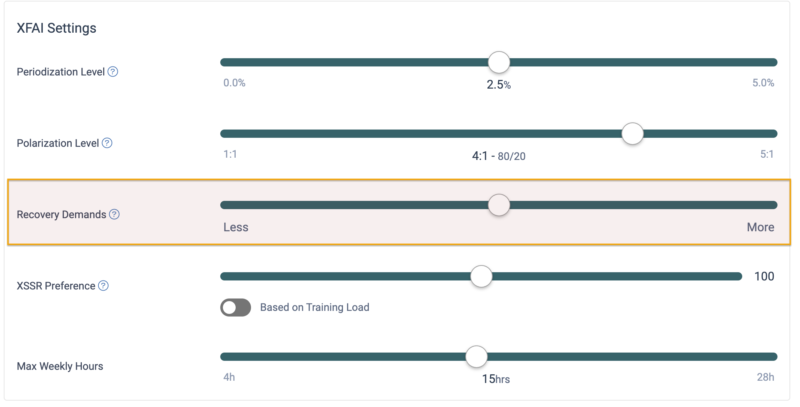
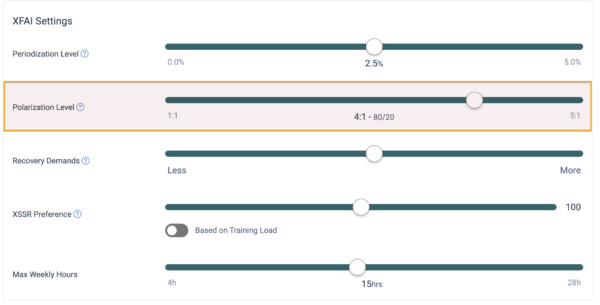
| Recovery Demands | Not everyone handles training volume equivalently. Some can train sooner after a workout whilst others might need a bit longer to recover. Most of this is explained by the difference in Training Loads since those with a higher Training Load can handle more training than those with lower Training Loads (this is, again, a by definition statement and physiological assessment). Those that average higher daily training volume than others are doing more and thus recover more quickly. But when Training Loads are the same, some may need a bit of extra time compared to others. In Xert, the value of Form that describes the Train/Recovery boundary is something you can tweak using the Recovery Demands slider. Sliding it right increases the Form values for all three that define a Train/Recovery boundary. Sliding it left decreases this. Ultimately, this governs the amount of recovery the system assigns between each training requirement in your Training Program.
|
||
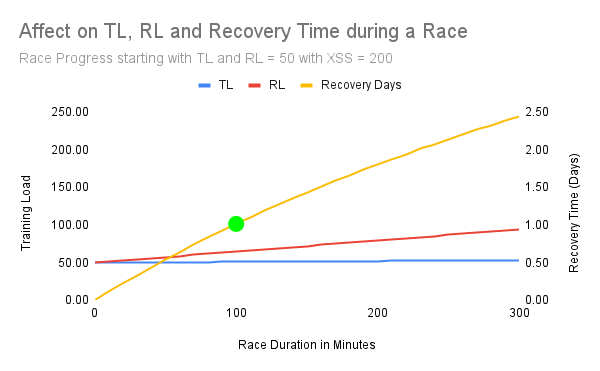
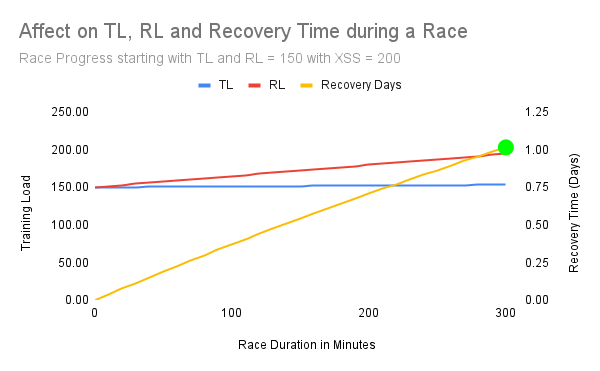
| Durability and Event Readiness | Recently, the concept of durability has grown in prominence as an important training metric that’s key to your performance in races. In Xert, we use Event Readiness as a way to characterize durability – if you’re ready for a race it means that you have built up enough durability to withstand the demands of the race, i.e. the Low, High and Peak XSS you’ll be required to perform. Durability lives in these models by virtue of being the opposite of fatigue. Being durable equates to less fatigue. If we know the demands of an event, we can pre-compute your accumulated fatigue both after and during. To withstand and reduce your fatigue, i.e. improve your durability, you’ll need to prepare by increasing your training accordingly. Longer, more demanding events (think greater XSS values) require more Training Load (Low, High and Peak TL) to prepare. Determining how much Low, High and Peak TL you’ll need is a matter of seeing how each TL and RL will be affected during the course of the event’s Low, High and Peak XSS accumulation. If we presume you’ll be fully fresh at the start, we can calculate what your TL and RL should be for each system such that you can complete the event without accumulating too much residual fatigue.
For example, if Low XSS is 200 for an event, what should your Low TL be in order to be *ready* for it? The answer depends on how ready you would like to be. If you just want to finish, then your Event Readiness may be a higher number and you’re fine with less durability. If you want to win and it’s a long race, you may want to improve your durability and increase your Event Readiness in order to withstand the demands as well as, if not better than your competition. In Xert, you can configure the Event Readiness you wish to have for your event and the system will allocate the appropriate amount of training you’ll need to perform to be ready.
|
||
| Tapering | Similar to Durability and Event Readiness, your TL and RL values at the start of a race and the demands of the race itself, will help identify the amount of tapering needed. For shorter events, going into the event with only a small taper might allow you to be at the top of your fitness whereas a longer, harder event might require all three systems to be fully recovered beforehand. Note that since RL’s decline is now capped, you can over taper for an event by resting too much beforehand and end up with less than optimal fitness and freshness for the event.
|
||
| Polarized Training | Polarized training is a training method often recommended by coaches and sports scientists as it has been shown to produce great results. Polarized training means that you should follow an 80/20 rule between low intensity/high intensity training. 80% of your training (4 out of 5 workouts) should be low intensity and 20% (1 out of 5 workouts) should be high intensity.
In Xert, by employing a 3 dimensional model with 3 systems, each with different time constants for TL and RL, and managing form across all three separately, we can see how some systems might need recovery while others are ready for training. This separation is why Polarized Training is advantageous – while some systems recover, other systems can be trained so you don’t need complete rest. We use a Train/Recover Form boundary value for each system, which helps define whether the system is ready-to-train or needs recovery. You can control this using the Recovery Demands slider. If Form is below this number, that system requires recovery. If Form is above this number, that system can be trained. This applies to all three systems in Xert – Low, High and Peak. Due to how the time constants work, your Low system recovers much faster than your High and Peak systems. Your Low system could be thought of as your endurance system so it makes sense that it can handle more and returns to ready-to-train much sooner, with your high and peak form taking longer to recover. This conveniently allows you to do endurance/Zone 2 training since your Low system is ready for training whilst your High and Peak system are still recovering. In Xert, Polarization Level can be adjusted and training programs like Forecast AI, can use your preferred Polarization Level, to allot the appropriate amount of high-intensity training such that you will recover according to the Polarization Level you choose. This ensures that your training isn’t just polarized but you will be doing sufficient high-intensity to fill the 80/20 or whichever Polarization Level you choose. One of the key tenets of polarized training is that high-intensity workouts are hard and low-intensity workouts are easy and the not hard enough and not easy enough workouts should be avoided. The natural expression of the Xert model’s time constants with your chosen Polarization Level is used to enforce this. It ensures you get an appropriate amount of high-intensity training such that you’ll recover in time to perform the next high-intensity training according to your Polarization Level. Note that if you don’t have time available to do all of the high and peak intensity needed for this, Forecast AI will spread out the intensity reducing the Polarization Level cycle in order for you to continue to progress towards your training target.
|
||
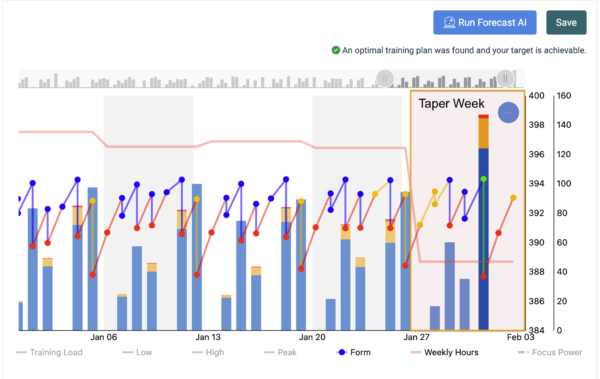
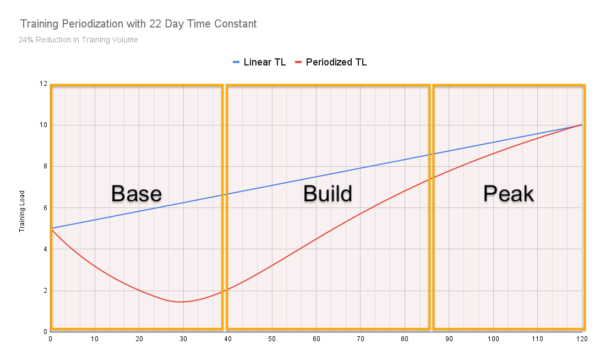
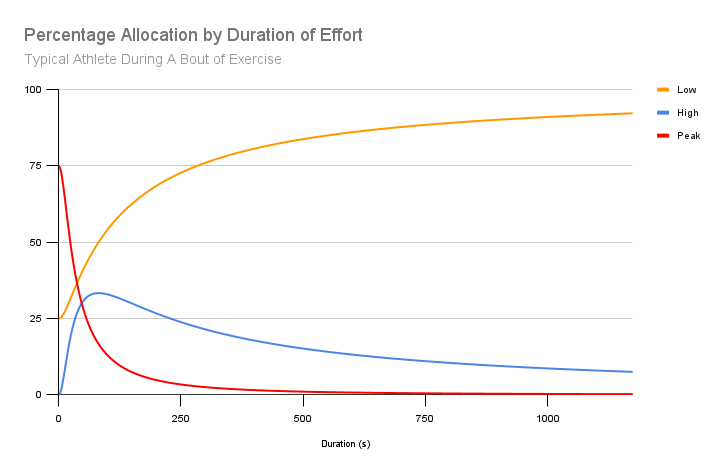
| Periodization | It’s been well established that the human body responds to high-intensity training much faster (in terms of how quickly you improve from training) as compared to low-intensity training. This means that what you need to train to optimize outcomes changes over the course of a training program. This change is a type of periodized training. In the Impulse-Response models, this translates into each system’s Training Load time constant. Those with longer time constants, take longer to buildup and those shorter time constants, can be built up sooner. This means that your Low intensity system (defaults to 60 days) and your High/Peak systems (default to 22 days) will need training at different times during the training program. Xert Adaptive Training Advisor implements a standard, preset 120-day Base-Build-Peak periodization method but Xert Forecast AI manages this build from low-intensity to high/peak-intensity based on the time constants you have set and your Periodization setting. Using the existing 22-day time constant, that’s been default TL time constant for High and Peak systems many years in fact, you’ll notice from the diagram below that a 120-day program will be naturally periodized into Base Build Peak over similar phases as the one used by the Adaptive Training Advisor by virtue of this time constant. This discovery and interpretation of the multi-dimensional system was a confirmation of how the model implements known training best practices without having to apply any arbitrary rules.
|