XSS Buckets
The Xert XSS Buckets data field is designed to elevate your training experience by providing a clear, real-time training goal for each ride. Integrated with Xert’s Adaptive Training Advisor and Xert’s new Forecast AI training programs, your training targets are automatically downloaded to the data field and tracked in real time as you ride.
XSS Buckets monitors your accumulation of Xert Strain Score (XSS) across the Low, High, and Peak ( L | H | P ) energy systems. As your ride progresses, each “bucket” fills up towards your training goal for the day. The data field logs into your account on Xert Online (www.xertonline.com), retrieves your latest Fitness Signature, downloads your daily training requirements, and displays these as buckets on your display:
How it Works
XSS Buckets works in conjunction with Xert Forecast AI (XFAI), Xert Adaptive Training Advisor (XATA), or your own self-selected workouts.
Your training targets, divided into Low (blue bucket), High (yellow bucket), and Peak (red bucket) is sent to your Garmin device as your training targets for the day.
When you start recording on the Garmin device, the data field logs into Xert Online and:
- If you have a scheduled workout, the Low, High, and Peak XSS for the workout are sent to the data field and displayed as targets.
- If using XFAI, the Low or High Intensity Forecasted Activity targets are sent to the device.
- Similarly, if you are on a Continuous, 120 Day Training Program, or Challenge, the training targets recommended by XATA are sent to the device.
In addition to showing your Low, High, and Peak XSS targets, the data field also displays XSS, Focus Duration, and Specificity Rating, providing different perspectives on your daily training targets.
If you are on an indoor trainer and performing a controlled workout, this field is fun to watch. It will help see how you are achieving the workout targets. However, if you are performing an unstructured ride, outside or maybe an indoor virtual ride then this field is especially valuable. In that case you can vary your intensity and perform ad hoc intervals to fill up the XSS buckets and work on hitting the Focus and Specificity targets. That is fun and challenging and gives you unlimited flexibility while still achieving your training objectives.
That also teaches you how to manage your Focus Duration and Specificity, real-time. Here are some starter tips:
- Focus Duration: Harder sustained efforts, ideally near your Focus Power, will drive your Focus Duration shorter, while long sub-TP efforts drive that metric longer.
- Specificity: A 100% Pure workout means all your strain was accumulated at the Focus Duration Target. If you want to move the metric toward Polar, you’ll want to perform short/harder bursts higher than Focus Power, and longer/easier recovery times under TP, between those bursts.
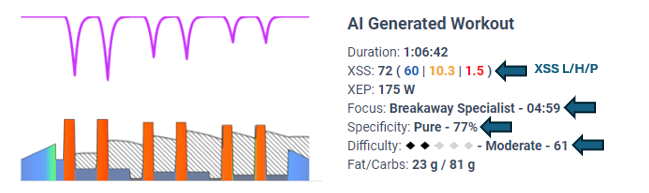
This is an example of an AI Generated Workout with specific XSS, Focus and Specificity targets. Note the information that shows the XSS low, high and peak targets as well as teh Focus and Specificity:
Installing and Setting Up the Data Field
Use the Connect IQ Mobile App from Garmin to install the data field onto your Garmin. Be sure to review the list of compatible devices on that page.
Navigate to XSS Buckets on Garmin Connect
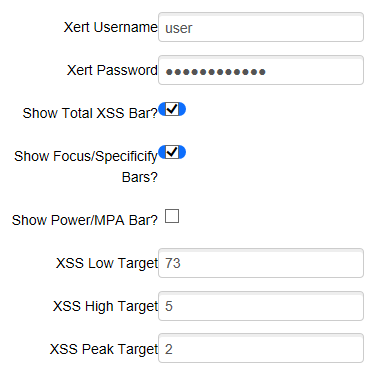
With the Garmin Connect IQ app configure your Xert Username and Xert Password under the data field settings so that the data field can log in to www.xertonline.com and obtain your daily training targets.
There are other settings you can adjust:
- Bars: You can pick which horizontal bars to show along the top. Note that content filtering may remove some of these if your field layout is too small.
- XSS Targets: this allows you to override the values that the XERT server sends to your device, in case you plan to perform a different kind of workout and already know the L/H/P XSS targets that you’d like to achieve.
Key Features
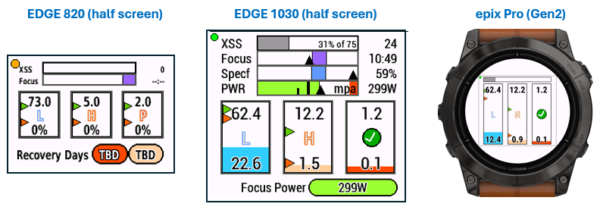
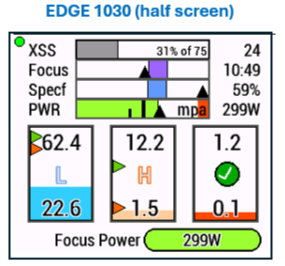
In this section, we’ll use the EDGE 1030 example since that demonstrates all the features. You can assign this field to a secondary screen. It is recommended that you either use a half-screen or a full screen view to see all the review information. For devices with smaller displays – Edge 500/800 & watches – we recommend only using the full-screen display.
1. Connection Status
The round dot in the upper left indicates the status of connecting to XERT Online to capture your current XSS targets. There are five colors you might see.
- PURPLE: your Garmin device isn’t connected to your cell phone (Bluetooth)
- BLUE: your cell phone isn’t connected to the Internet (cellular or WiFi)
- ORANGE/BLACK: the Field hasn’t yet connected to XERT
- RED: the Field failed to log into XERT
- GREEN: the Field has successfully logged in and captured your Targets
NOTE: Once the Field successfully logs in and captures the Targets from www.xertonline.com, the dot will remain GREEN even if your device is no longer connected to your phone.
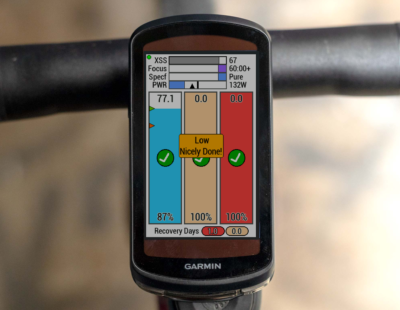
2. Horizontal Bars
Depending on the available space, XSS Buckest will have 2-3 horizontal bars. These bars show your XSS Total, Focus Duration (Focus), and Specificity Rating (Specf).
XSS Bar
This shows the total XSS as it accumulates over time. For example, if your target is 75, and you are currently at 31% of the target with 24 XSS, it will be displayed here. Note that the total XSS is the sum of the three bucket targets (Low + High + Peak).
Focus Duration
The value on the right is your actual/current Focus Duration (FD). The black triangle represents the workout’s Focus Duration Target. The little box moves left/right as your FD changes over time. When the box overlaps the target, it will turn green. If your workout is Low Intensity with almost zero XSS in High and Peak, then you won’t have an FD Target, it will show as NA. In this case, enjoy a nice Endurance or Recovery type ride.
Specificity
The value on the right is your Specificity Rating, which is shown as a percentage and described as Polar, Mixed, or Pure. Polar is <= 33% (left side) and Pure >= 67% (right side). The little box turns green when you are within range of the target.
3. Low/High/Peak XSS Rectangles or “Buckets”
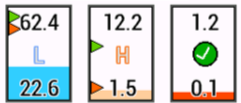
These are the XSS Low, High, & Peak buckets and they will fill up as you ride! The values on top of the rectangle represent the individual XSS targets for the activity. The values on the bottom alternate between actual XSS and percentage completed so far in your ride. The triangles indicate levels at which you receive “badges,” with the orange triangle representing the Warn level and the green triangle representing the Good level. While the goal is to achieve 100% of the XSS targets in all three energy systems, you will receive a checkmark once you are close to a specific XSS target. Be careful not to overdo things, since exceeding the target by a significant margin will also trigger a warning, which can help you manage your training more effectively and help prevent overuse injuries and/or burnout!
4. Bottom Metrics
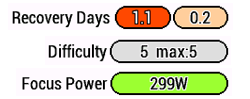
At the bottom of the data field, you will see a rotation of valuable metrics:
Recovery Days
The red pill shows the number of days your training status will be red as of that point in the ride. The yellow pill is the number of days your Training Status will be yellow as of that point in the ride. These correspond with the recovery days shown on the new Xert Forecast AI training reports. Review the Training Status colours to better understand what red status means.
Difficulty
This metric displays your current Difficulty Score, which increases with workout intensity and decreases during recovery.
Focus Power
This represents the power associated with the Focus Duration of the training requirement. Aim to use this power, or slightly above it, as your interval power target to hit your low, high, and peak XSS targets.
XSS/hr & Time Remaining
This field shows a 20-minute smoothed metric of your recent average stress rate (XSS per hour). This value is used to calculate the Estimated Ride Time Remaining, which provides an estimate of the time left (hh:mm) to fulfill your XSS training needs for the day, helpful for you to determine how much longer you may need to ride to complete your training.
Notes
- If a rest day is scheduled and you decide to ride, the data field will show Active Recovery XSS target values with Low=27, High=0, Peak=0. Your Focus Power will also be reduced.
- If you have a Low Intensity workout scheduled, then your Focus Power will be set to your LTP.
- If the Garmin had an issue logging into www.xertonline.com (the dot does not turn green after a minute or so), then you can tap STOP and START again, and that will trigger the field to attempt to log in again. You can also use the STOP and START sequence to refresh the targets if a change was made on the server.