Advanced Data Analysis with Xert
Xert continues to introduce new concepts that change the way athletes analyze power data, uncover insights, and measure performance. These methods provide an in-depth understanding of your fitness and performance, offering athletes data-driven answers to key training questions. In this post, we’ll explore how you can gain a better understanding of your performance during a ride, race, or workout with Xert’s advanced analysis tools.
Analyzing your Data After Your Ride
Once your activity data is uploaded or synced, it’s natural to want to understand more about your performance. Key questions often include:
- How well did I perform?
- Is my fitness improving?
- Why did I get dropped or fail to bridge?
- Why did my attack succeed or fail?
- Why couldn’t I sustain the power I thought I could?
- Where did I experience a breakthrough?
- Am I ready to take my training to the next level?
- What should I focus on improving?
These are just a few of the questions athletes ask when reviewing their data, and often the answers are hidden in plain sight. With Xert, these insights are illuminated, providing you with a clearer understanding of your ride. Let’s dive into how Xert helps answer these questions.
Analyzing the Overall Ride
The first thing most Xert users do after uploading their activity is look for a fitness breakthrough. A gold trophy icon indicates that a breakthrough has occurred—signifying that all three fitness signature parameters has increased during the activity. This feature is unique to Xert and can detect breakthroughs at any point during a ride! From the Activities Dashboard, you can see exactly how your signature has changed as a result of the ride:

From the Activity Summary page, we also see a ◆◆◆◆◆ – Hard rating, indicating the difficulty rating of the activity. This rating measures how hard the ride was by identifying the longest sustained period of maximum effort during the activity. Ratings above 3.5 are rare for most athletes, so seeing this rating is a clear sign that you pushed yourself hard.
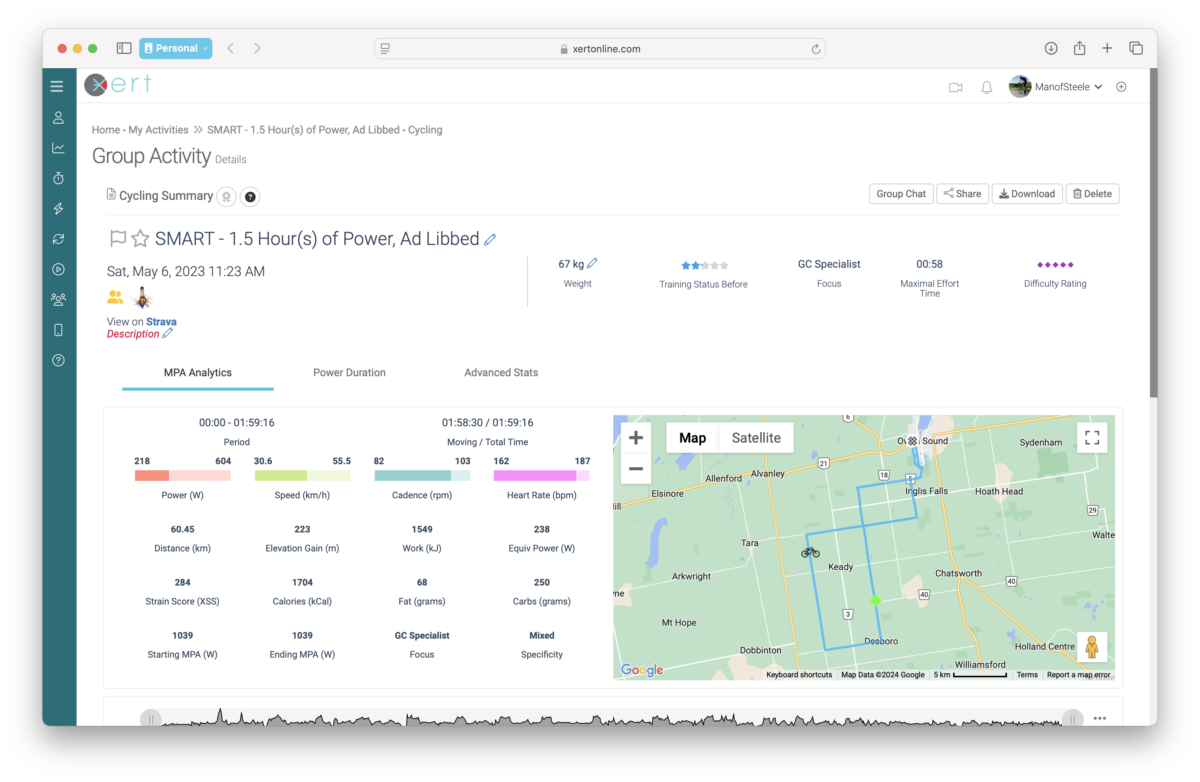
Maximal Effort Time (e.g., 00:58) show how much time you spent at or near your maximum effort. The longer the max effort time, the more Xert has to work with to generate an accurate fitness signature. In Xert, this number also corresponds to the size of the Breakthrough circle on your Progression Chart.
Focus (GC Specialist = 8 min W/kg) and Focus Duration (07:27) metrics tell you indicate that this activity included many harder efforts such that, in total, this activity trained your ability to hold your ~8 Minute Power. Again, this metric is unique to Xert and tells you “What aspect of my fitness was most exercised during this activity?”
Specificity Rating was Mixed (if you mouse over it, it will show the actual percentage). The higher the Specificity Rating (Pure specificity), the greater the high-intensity strain was near your actual Focus power. A lower value (Polar specificity), means that little high-intensity strain was at the specific power level. Lower specificity ratings often correspond with lower overall intensity activities for this reason. Again, this metric is unique to Xert and tells you “How much did I exercise this aspect of my fitness?” This provides you another dimension to your activities and workouts unavailable elsewhere.
Note: All the metrics in the Analytics Table will update as you zoom in and out on the MPA chart, providing a dynamic view of how the metrics change based on your selected time frame.
Reviewing Specific Efforts
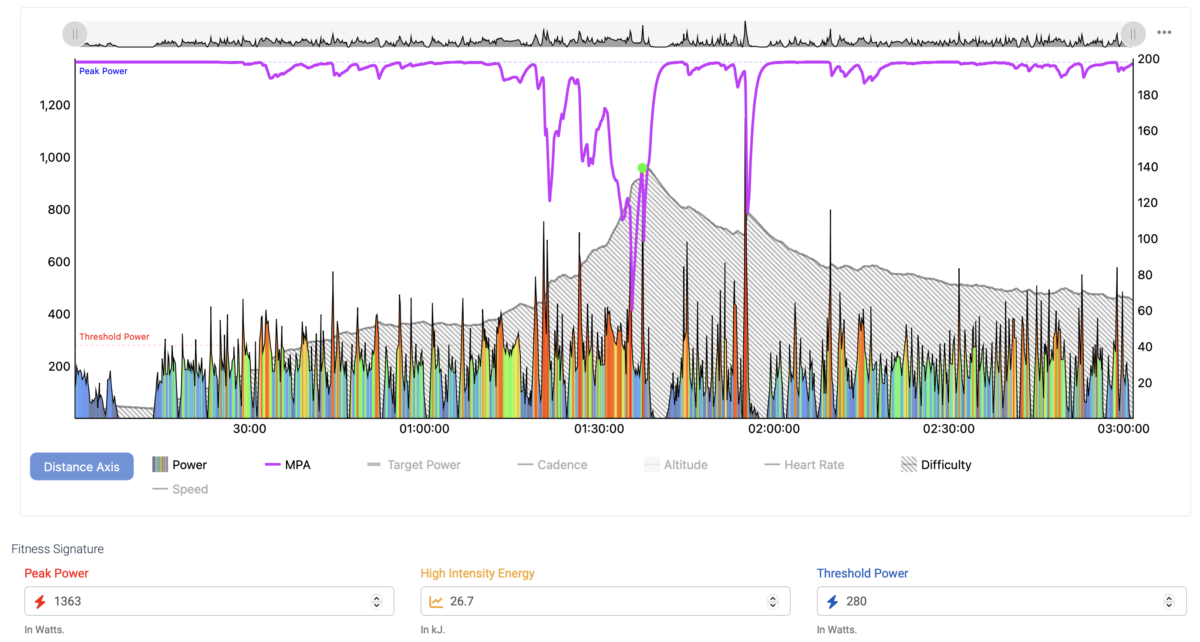
Athletes often like to compare their performance on segments or efforts, but comparing results from different rides or races can be tricky. Factors like wind, drafting, fatigue, and execution can all impact performance, making it difficult to judge if an effort was executed to its full potential. This is where Maximal Power Available(MPA) analysis helps!
MPA accounts for fatigue, enabling you to better assess whether you truly “emptied the tank” during an effort. Here’s what you can learn from analyzing your efforts:
- If your power reaches MPA at the end of an effort, it means you successfully pushed to your limit, indicating you gave it everything you had.
- If MPA drops to meet your power, it suggests you were “hanging on,” struggling to maintain your effort until the end.
- If your power does not reach MPA, it means your effort could have been better! You may not have executed the effort as well as possible, or your preparation could have been improved.
Let’s zoom in on our activity to see if we can get more information on our particular efforts (to show the elevation, click on the Altitude link in the legend below the chart):
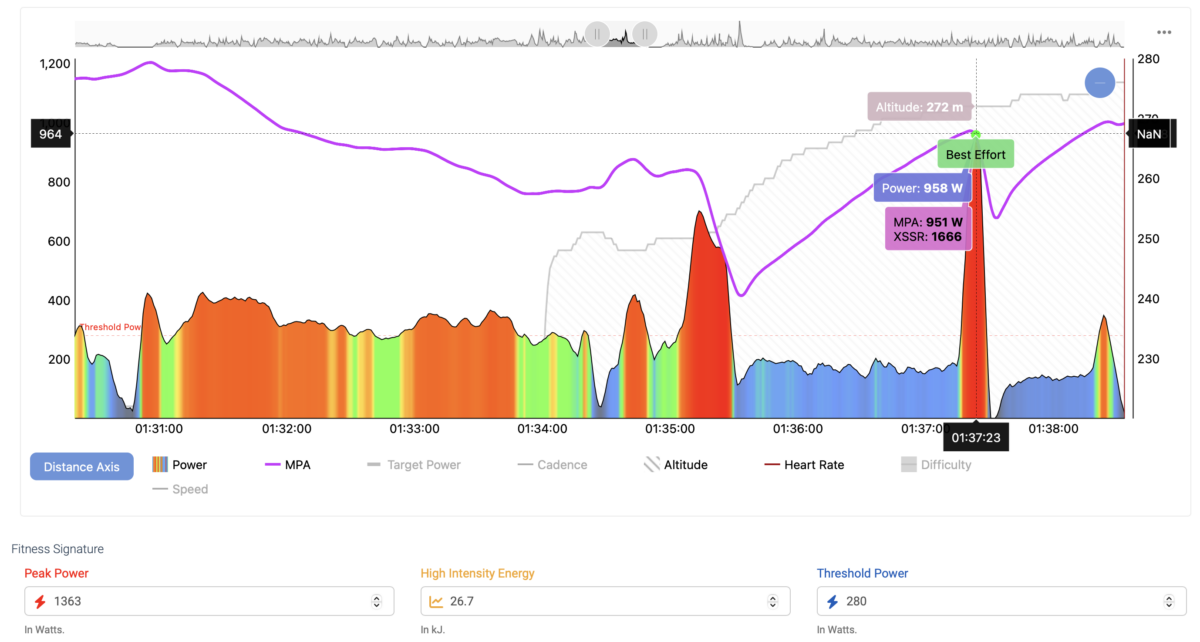
In this example, at approximately the 1:35:16 mark, we can see that the effort was sustained until it could no longer be maintained. This is an indicator of a true maximal effort. The second effort was an effort to produce as much power as available, which was again limited by the athlete’s MPA.
Now, let’s examine the third effort in the activity:
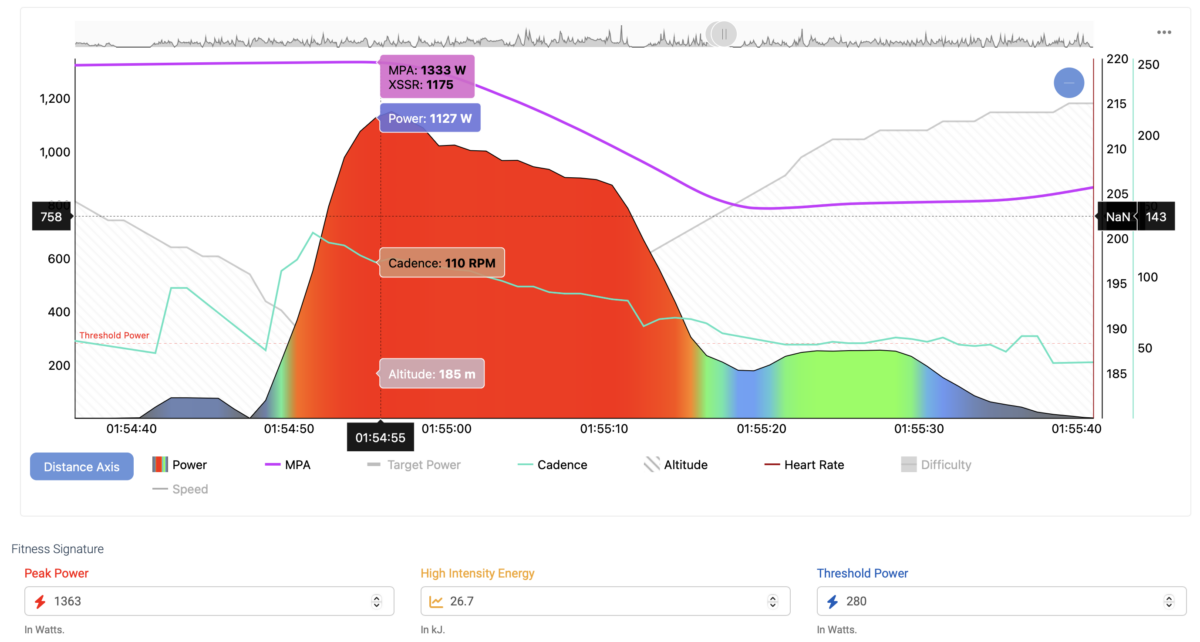
We see that we came close to reaching MPA, but didn’t quite hit it. We can learn a lot from examining this particular effort. By zooming in, we can see that part of the effort occurred on a flat and then during a short climb. Using Xert, we can pinpoint exactly where this happened on the map, helping us remember the specific effort. The zoomed in section was for 30 seconds and the average power was 768W with a peak at 1150W. Cadence had a peak of 131RPM and averaged 94RPM for the effort (to view, click on the Cadence link in the legend). The effort was started in a fatigued state – MPA was ~1330W at the start of the effort and declined to ~800W by the end. We wouldn’t expect our 30 second power, therefore, to be near our highest 30 second power. Even if we had held MPA for 30s, it would be below the highest we would be capable of because it had started in a fatigued state.
This highlights an important point: many efforts, especially during race or club rides, are initiated in a fatigued state. Comparing efforts across different activities may not always provide meaningful insights unless you account for the state of fatigue at the start. So, while this was a solid effort, we wouldn’t expect it to be our best possible performance under ideal conditions.
Why did we not reach MPA? Efforts later in the ride where some long-term fatigue has been accumulated can be more difficult to attain MPA. Also, execution with your best cadence is important, particularly with higher power efforts. Notably, for those that have been performing our SMART Workouts, you’ll often notice these natural, XSSR-like efforts in your data as in this effort. Matching target power dynamically with fatigue is only available in Xert!
What should you be looking to improve?
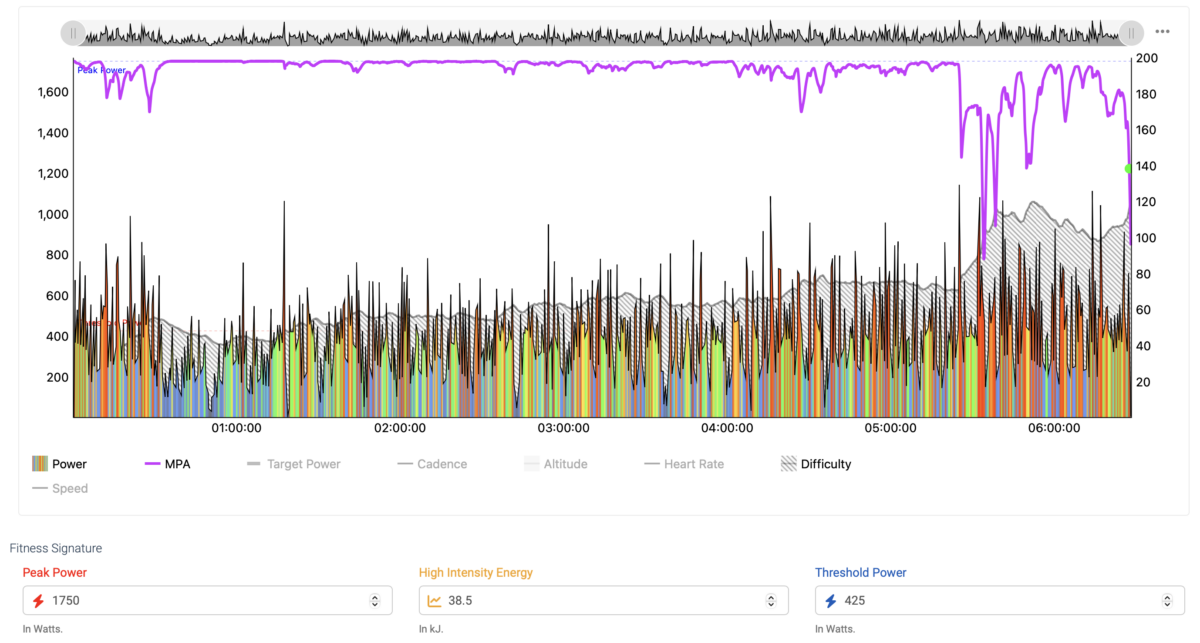
For elite athletes, what might feel like an incredible effort for an amateur could be just another easy day at the office. Elite athletes can repeatedly produce high-intensity efforts, perform at peak levels, and recover quickly. Their ability to repeatedly reach MPA—even after hours of intense effort—sets them apart. Take, for example, Mathieu van der Poel’s performance at the 2019 Amstel Gold Race. After five hours of racing, he was able to reach his MPA again to power through and secure the win, showcasing the endurance and resilience required at the highest levels:
Here are three key factors that differentiate elite athletes:
- High Fitness Signatures – The ability to produce high power across all intensities.
- High Ratings/Hardness Scores – The capacity to repeatedly produce maximal efforts during training or competition.
- High Endurance Capacity – The ability to maintain peak performance over extended periods.
Improving all of these three is the recipe for success in cycling.
While improving FTP (Functional Threshold Power) is a common goal, fitness goes beyond just FTP. Improving Threshold Power, High Intensity Energy, and Peak Power will give you the ability to perform at a variety of intensities, ensuring that you can sustain power for longer periods and at all intensities.
Cycling demands that athletes consistently perform their best, and the ability to repeat maximum efforts is what sets top cyclists apart. From a data perspective, this is reflected in how MPA is managed throughout the ride. Successful athletes can repeatedly draw MPA down and maintain it, demonstrating exceptional toughness and resilience. This ability to manage effort and maintain high power over time is the definition of hardness in Xert, and it’s what separates the best from the rest.
Finally, long rides and races—lasting 3, 4, or even 5 hours—require athletes to produce near-breakthrough efforts well after the early stages of the event. Being able to perform at a high level after hours of racing requires years of training and meticulous preparation. Elite cyclists, in particular, are able to perform at the same intensity at the end of a race as they did at the start. This ability to reach MPA later and later into a ride is a sign of superior endurance and fitness. In your training, aim to push your ability to reach MPA later into your rides, and work towards maintaining high performance even as fatigue sets in.
Comparing Your Data
At first glance, comparing one effort to another may not provide the full picture. Average power and normalized power are helpful, but they don’t tell you how difficult it was to produce that power or whether you were operating at your maximum. Xert makes it easy to assess this by showing the relationship between power and Maximum Power Avaiable, giving you a clear picture of how fatigue is impacting your performance. MPA is the key metric because it reflects your current capacity and available power, allowing you to see how well you manage your effort and whether you’re pushing yourself to the limit.
Updated 18 Dec 2024


