Xert Full Glossary with Description
- Activity Time
The Activity Time setting in Xert allows you to define how the platform calculates and displays key metrics like average power and cadence. This setting also determines how activity times are shown in the Activities Dashboard and Progression Tab.
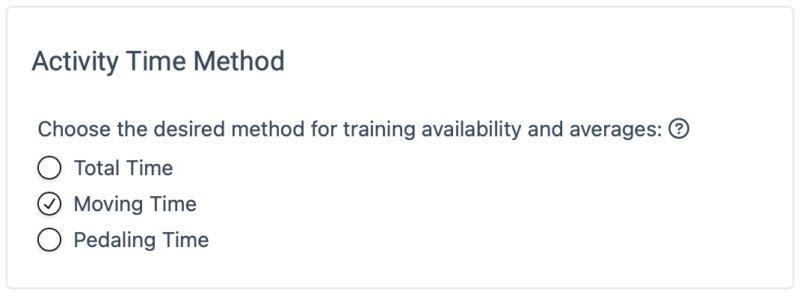
- Total Time: Displays the total elapsed time for the entire activity, including all stops and pauses.
- Moving Time: Reflects only the time spent moving during the activity, including coasting, and excludes rest or stop periods. This provides a more accurate measure of active cycling time.
- Pedaling Time: Shows the time spent actively pedaling during the activity, excluding periods when you aren’t pedaling. This option is especially useful for comparing indoor vs. outdoor activities, as indoor rides typically have less coasting.
To change your Activity Time Method setting, open the Profile Settings / General tab.
For example, if you set your Activity Time to Moving Time, the activity cards in Xert will display the time spent actively cycling, excluding any breaks or stops. As a result, Xert will recommend workouts based on your active cycling time—so if your workout goal is to ride for 2 hours, it will calculate the duration based on moving time, not total elapsed time. This means that your total elapsed time may be longer than the active time shown.
- Adapt Forecast
Adapt Forecast allows athletes to dynamically update their training plan to reflect changes in availability, the addition of other planned activities, or adjustments in the execution of the training plan. This could happen if an athlete has completed more (or less) training than originally recommended by the Forecast AI plan, when new activities are added (such as a group ride, race, or commute), or if there are scheduling changes mid-plan.
Adapt Forecast is a user-driven feature, meaning it does not run automatically. The reason for this is that the optimization process may move training days around, adjusting intensity levels between high and low as needed. Since this could impact your plan at any time, we’ve designed it so that athletes have full control over when to adapt their forecast, rather than having the plan change automatically.
Note: If you fall too far behind in your training and the original target goal/event becomes unachievable, you will need to modify your targets in the Program tab for the Adapt process to complete successfully.
Typically, the Adapt Forecast process will rearrange your upcoming week to bring you back on track. This is known as the first pass. In some cases, your changes may require minor adjustments to the rest of the plan, which would be the second pass. However, if significant changes occur (e.g., if a planned training day is no longer available), the Forecast AI optimization process will need to re-run to accommodate these changes. You may consider re-forecasting your training plan from the Program tab of Xert.
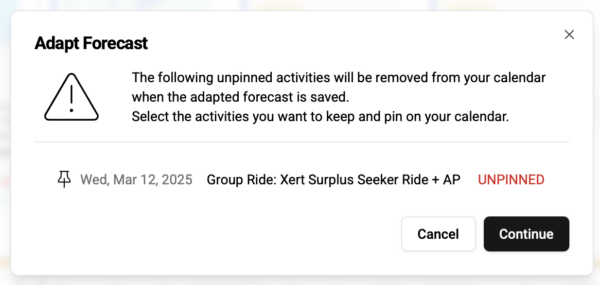
Important Note: When Adapt Forecast runs, any scheduled workouts or activities that are not pinned will be removed. This is because those workouts may no longer be optimal due to changes in settings or availability. Before adapting your plan, you’ll receive a pop-up notification that lists the workouts and activities that will be removed. This allows you to easily pin the workouts you want to keep, preventing unwanted removals and giving you full control over your training plan.
When changes are needed, Adapt Forecast will display a red dot, signalling that you should consider running the Adapt Forecast process. In the beginning, you might run this process more frequently to see how it works, but over time, if you’re sticking closely to your plan, you may find you only need to run it occasionally.

- Advanced Activity Stats
What are Advanced Stats?
Advanced Stats is a feature that allows users to analyze Strava Segments or their lap data from their activities. In addition to seeing some of the basic information you would expect to find: average power, speed, etc. Xert will also calculate & display the starting & ending MPA for each lap or Segment, as well as the calculated Focus & specificity for a particular region of a ride!

Accessing Advanced Stats
- To view your lap & segment details, start by selecting the ‘Advanced Stats’ tab on the Activity Details page. Next, use the drop down menu to choose between viewing Lap data or starred Strava Segment data:
- If you don’t see any segments listed, ensure that you have already starred a few segments. For more on that, check the Strava support page on Starred Segments.
- Once you have starred some segments, you can click the ‘Refresh’ button and Xert will fetch your starred segments.
- Tap on a segment to view the summary information, such as at the segment distance, time, average power/speed, as well as your Personal Record (PR) and the King/Queen of the Mountain (KOM/QOM) time. You will also notice links to the activity with your PR effort in Strava and in Xert.

- In addition to showing you information about your current effort, PR, and KOM/QOM effort, the map will zoom in to show the starting & finishing point of the lap/segment. The data table will also update to show data specific to the selected lap/segment, including the Xert Strain Score (XSS), Starting & Ending MPA, Focus & Specificity, as well as Fat & Carb used up during your lap/segment effort.
Breakthrough Effort
In addition to showing your current segment effort and your best segment effort, Xert will calculate a Breakthrough effort. To do this, Xert looks at the power data from your best effort and uses your MPA & fitness signature to calculate the highest effort you could sustain across that segment. The best estimated effort is calculated by scaling up your Segment best effort until MPA is reached at one point during the segment effort (e.g. a Breakthrough effort). Note that this won’t be a constant power effort across the segment. Rather, we use the pattern in your power data from your lifetime personal record to account for things like climbing & descending hills, stop signs, etc. From there, Xert can estimate your speed data using the best estimated power and determine your estimated best effort for that segment.
Note: Keep in mind that wind speed/direction will likely have an influence on your PR/KOM time as well.
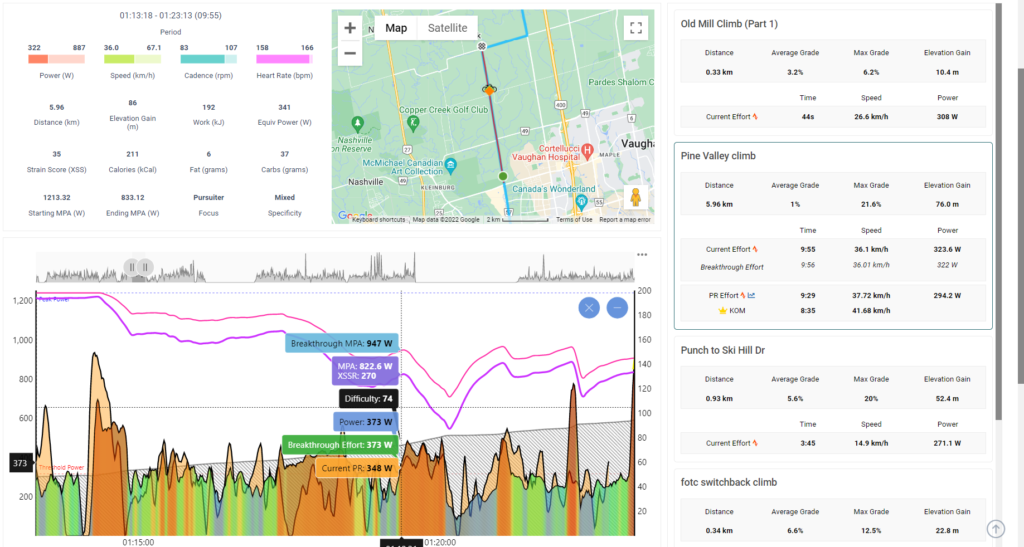
After clicking on a Segment, the MPA chart will display the current effort Power & MPA, your Personal Record effort (in orange), and the Breakthrough Effort (in green). Looking closely at the map, you’ll also notice a second by second comparison on the map of your current effort (bike symbol), PR effort (orange diamond), and the Breakthrough effort (green diamond). You can also toggle the horizontal axis between time & distance:

Frequently Asked Questions
“Why don’t I see any Segments under Advanced Stats?”
- A Strava Premium subscription is required for segment analysis
- Only starred segments will be displayed for segment analysis
- The ride must be synced between Strava & Xert. If the activity does not show ‘Open in Strava’, then Xert cannot fetch the Strava segments. We recommend deleting the activity and re-syncing the ride from Strava
- To view your lap & segment details, start by selecting the ‘Advanced Stats’ tab on the Activity Details page. Next, use the drop down menu to choose between viewing Lap data or starred Strava Segment data:
- Athlete Type
These are categories that associate with a given Focus Duration point on the power-duration relationship and may or may not account for weight. Your training in Xert is influenced by your selected athlete type – for example, a sprinter’s training program will be different than a Rouleur!
The categories for cyclists are defined as follows:
Sprinters & Attackers
- Road Sprinter : 2 minutes power to weight (W/kg)
- Pursuiter : 3 minute power
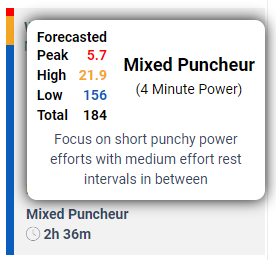
- Puncheur : 4 minute power to weight (W/kg)
- Breakaway Specialist : 5 minute power
All-Rounders
- Rouleur : 6 minute power
- GC Specialist : 8 minute power to weight (W/kg)
- Climber : 10 minute power to weight (W/kg)
Endurance
- Sprint Time-Triallist : 20+ minute power
- Time-Triallist : 1 hour power
- Century Rider : 2 hour power
- Endurance/Triathlete : 3 hour power
NOTE: For Focus Athlete Type categories assigned to workouts, any workout that has greater than 20:00 focus is labeled as Endurance for ease of understanding.
- Challenge
Challenge is one of Xert’s 3 program types. This program type is designed for athletes who may not be training for a particular event, but want to challenge themselves to improve their signature as much as they can over 30 days. With Challenge program type selected, Xert’s Adaptive Training Advisor will recommend the training based on your selected improvement rate with a Focus centered on your selected athlete type.
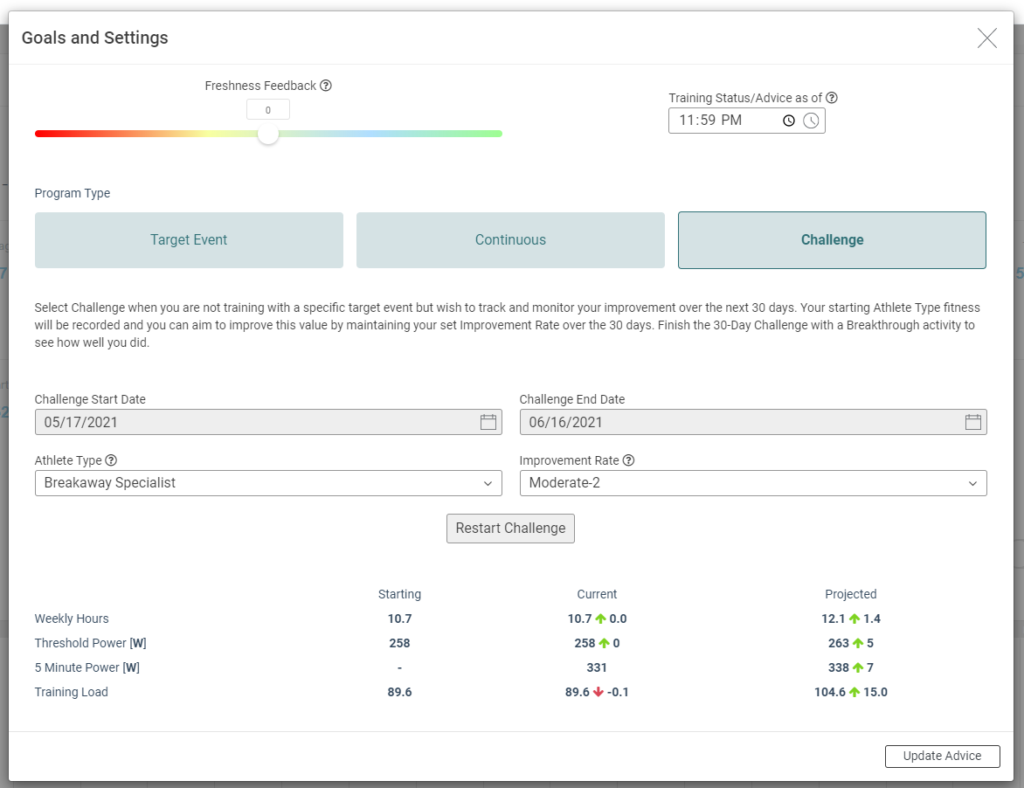
With the Challenge program type selected, you will be able to edit your Athlete Type and Improvement Rate. You can see the challenge Starting & Ending dates. Selecting the option Restart Challenge will reset the 30 day challenge using today’s date as the first day of the challenge – this can be helpful if your challenge was disrupted by sickness, injury, etc. Along the bottom of the dialogue screen, you’ll see how your current estimated weekly training time (in hours), Threshold Power (in Watts), Athlete Type power (in Watts), and Training Load compare to the starting date of the challenge, as well as how Xert predicts those values to change by the end of the 30 day challenge, based on your current training load and your selected athlete type and improvement rate.
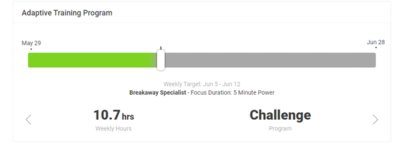
When Challenge program type is selected, the Xert Adaptive Training Program – located under the ‘Train’ tab on Xert Online, or the ‘Train’ tab of Xert Player for iOS – will display your progression through the 30 day challenge, as well as how your signature is improving relative to the target improvement rate of the challenge. Green sections indicate days where you are ahead of the projected improvement, while red indicates days that you are behind the projected improvement.
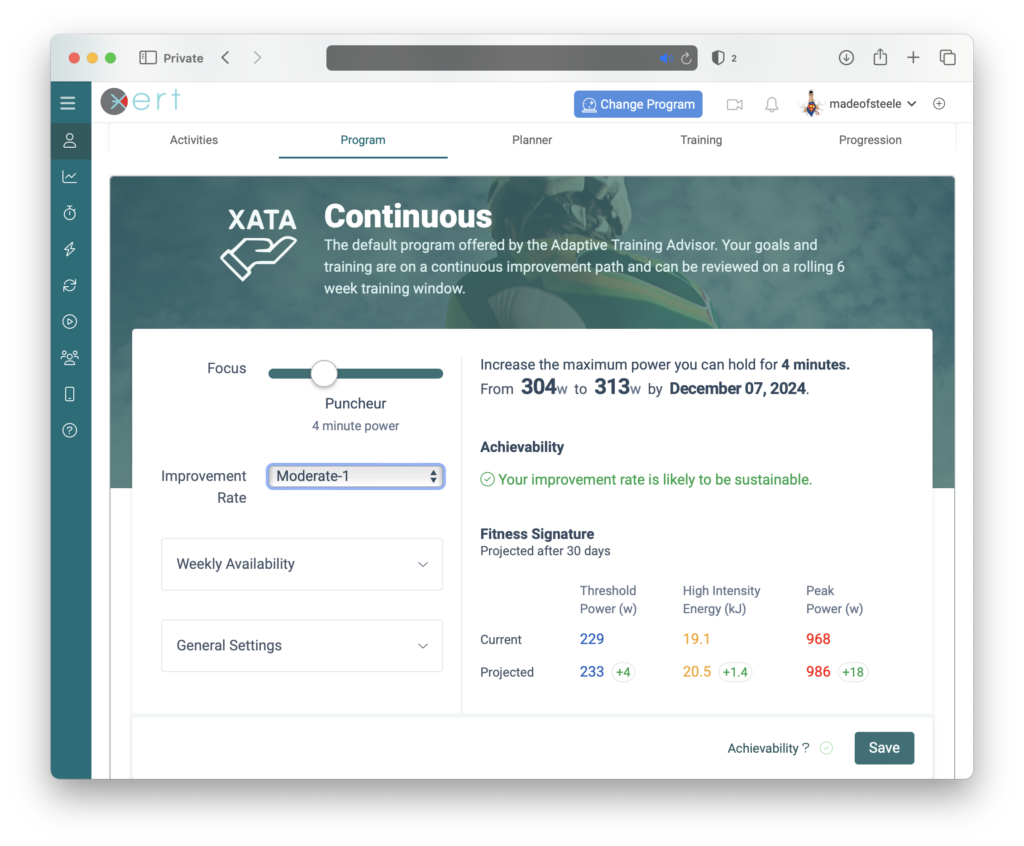
- Continuous Improvement
Continuous Improvement is one of Xert’s 3 Program Types. This program type is perfect for athletes who may not be training for a particular event, but may instead ride for general fitness, for fun, or to push themselves to their own personal limits. With Continuous Improvement selected, Xert’s Adaptive Training Advisor will recommend the training needed to maintain your selected improvement rate with a general Focus on your selected athlete type.
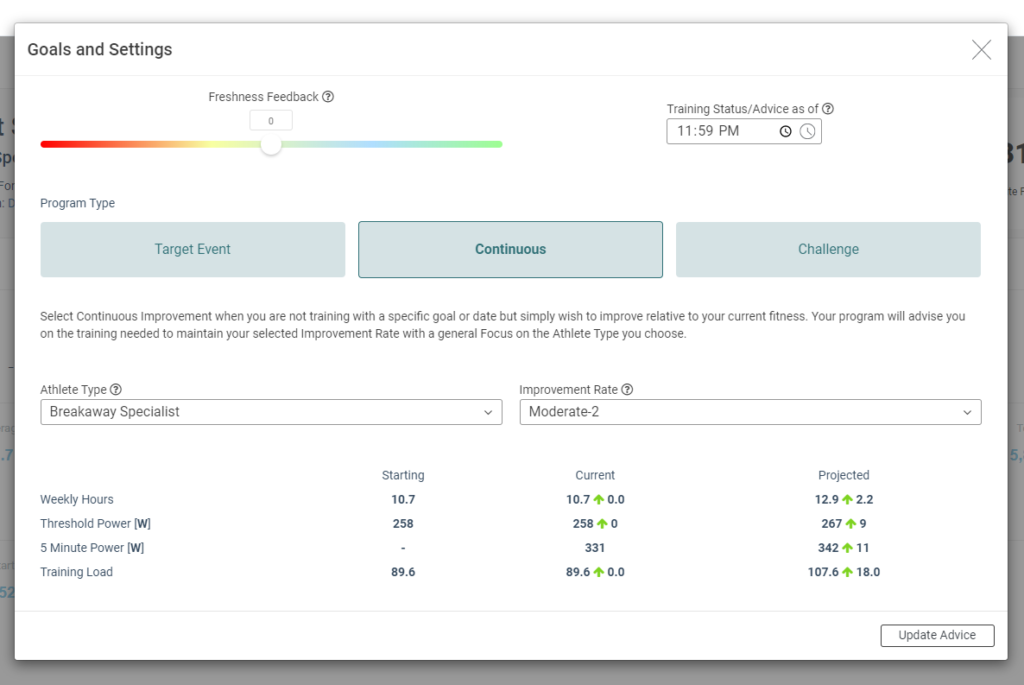
With the Continuous Improvement program type selected, you will be able to edit your Athlete Type and Improvement Rate. Along the bottom of the dialogue screen, you can see how your current estimated weekly training time (in hours), Threshold Power (in Watts), Athlete Type power (in Watts), and Training Load compare to 6 weeks ago, as well as how Xert predicts those values to change in 6 weeks with the currently selected Athlete Type and Improvement Rate.
When Continuous Improvement program type is selected, the Xert Adaptive Training Program – located under the ‘Train’ tab on Xert Online, or the ‘Train’ tab of Xert Player for iOS – will display how your actual improvement has looked over the last 6 weeks:
Improvement Rate above 7: Red
Improvement Rate between 0 and 7: Green
Improvement Rate below 0: Blue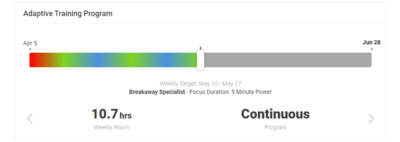
- Current Training Load
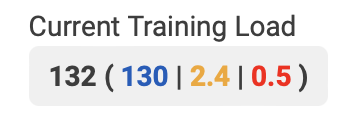 Current Training Load shows your total training load, as well as the distribution among each energy system. You will find training load represented as Total ( Low | High | Peak). Notice that the colour coding of the Low/High/Peak training loads corresponds with the matchstick colours.
 - Difficulty Rating
Difficulty Rating is a calculation that uses the Difficulty Score for a workout or activity and is determined as the highest difficulty score attained. As a general rule, those workouts/activities with greater difficulty require a higher training status to be successfully completed by the athlete, although there is variance amongst individuals. Races and/or intense groups rides often result in a higher Difficult Rating due to the added motivation on behalf of the athlete.
The ratings are categorized as follows:
Rating Recommended Minimum Training Status Level Difficulty Score 1 Easy Less than 45 1.5 Easy From 45 to 50 2 Moderate From 50 to 62 2.5 Moderate From 62 to 75 3 Difficult From 75 to 90 3.5 Difficult From 90 to 110 4 Tough From 110 to 130 4.5 Tough From 130 to 150 5 Hard Greater than 150 - Difficulty Score
Difficulty score (DS) provides a measure of how much strain has accumulated over the course of an activity or workout. Rather than using simple power averages or weighted power averages, difficulty score establishes the impact of repetition and constant, higher-intensity efforts are to perform for the athlete based on their unique fitness signature. Difficulty score is calculated as an exponentially weighted moving average of XSS Rate; it is not influenced by the duration of your ride.
Difficulty score aims to capture and quantifies the effects of repeated and/or sustained hard efforts and is shown in activity charts and workouts. The highest difficulty score reached in an activity/workout determines the Difficulty Rating. Reaching higher levels of difficulty corresponds with increasing athletic hardness and is a marker of elite athletic ability.
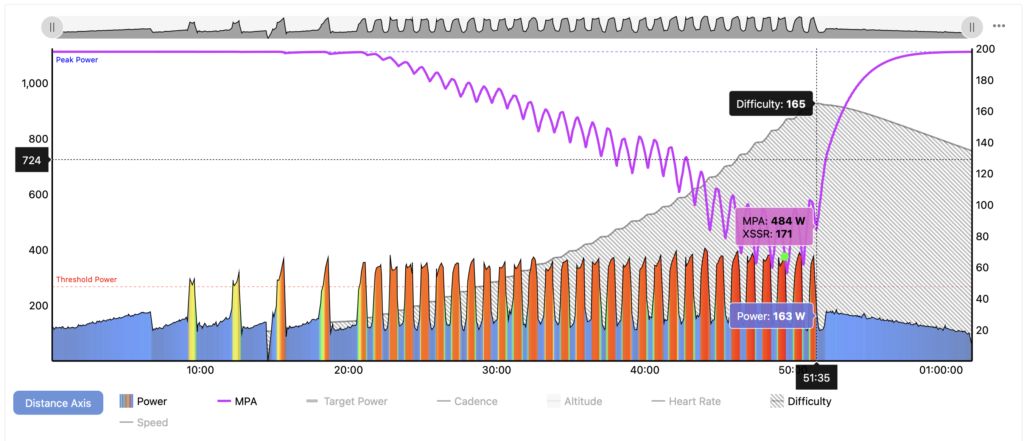
Intervals that take you to failure, like those in the SMART – Test Your Might workout will drive DS up rather quickly! Note that Difficulty Score on the MPA chart maxes out at 200. If you are achieving > 200 DS in your rides, it’s likely your fitness signature is underestimated. It could be time to push yourself for a Breakthrough!
Consider this metric to improve your pacing and strategy during group rides, races and time-trials by looking to prevent increasing the difficulty unnecessarily. One can compare the trade-offs in improved results with the challenge of meeting the higher levels of difficulty that will need to be endured.

Xert also uses DS when recommending workouts so that your workouts are never too hard! For more on that, check out our blog post, here.
- Durability Metric
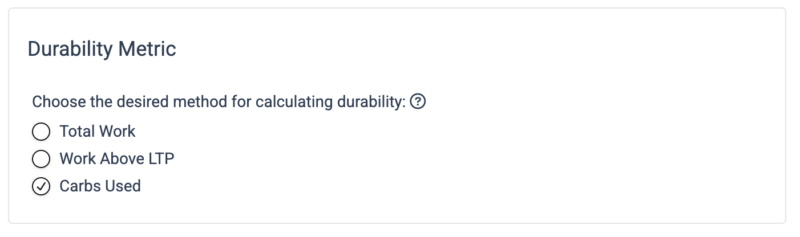
Choose the Durability Metric that will be used to assess Durability Scores for activities. Here’s an explanation of each option:
Option Description Units Total Work The total work performed is tallied and the rate of decline of your signature is calculated as a function of this. This is a good general metric to use but doesn’t properly account for the differences in intensities. 1000kJ of work performed at an easy intensity (<< LTP) will have little affect on durability whereas 1000kJ of work performed near or above Threshold Power will have a great effect. % Decline per 1000 kJ Work Above LTP Work Above LTP is an improvement over using Total Work but this also presumes that work below LTP will have no effect on durability and that all work above LTP is equivalent. % Decline per 200 kJ Carbs Used Carbs Used is an improvement over both Total Work and Work Above LTP since this include effects on durability from all intensities and will scale higher with higher intensity. In addition, you can indirectly assess the affect of fuelling strategies. Carbs Used will also enable a Carbs Replenished additional input value per activity that allows you to input how many carbs were consumed and used as energy during the activity.
% Decline per 50 grams - Durability Score
Durability Score is an assessment of the effect on your fitness signature after hours of riding/exercise/activity. Xert normally evaluates your fitness signature as a single set of 3 values that do not change over the course of an activity. When durability is included, your fitness signature changes over the course of the activity.
How to Use Durability Score
To properly assess durability scores, you should choose activities that are longer than 3 hours and activities where you know you felt you were at your limit after 3 or more hours. This could be from a final climb during a race and all-out 3 minute TT, for example. Just feeling tired at the end isn’t enough to assess durability. A max effort while fatigued from a long ride is necessary. Note that if you had a breakthrough during the activity, you may not be able assess your durability.
Steps:
- Locate an activity that is more than 2 hours long. Often a race is a good candidate.
- Determine / try to recall if you had a maximal effort towards the end of the ride/race.
- Ensure you didn’t have breakthough during the event. This makes it difficult for the system to assess how your fitness signature changed during the activity.
- The system has identified a good representative fitness signature for you at the start of that ride/race. An over/under estimate can impact the assessment. Note any potential effects from your chosen Signature Decay.
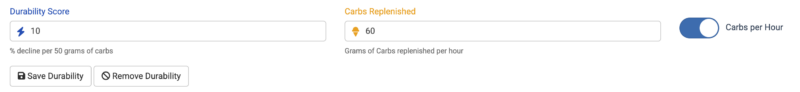
- Click the Assess Durability button
- (Optional) If using Carbs Used as your Durability Metric, input the Carbs Replenished either as a total or as a per hour values. Assess Durability again.
- Click the Save Durability button if the assessment appears to be a realistic interpretation of the changes in your fitness signature.
How it Works
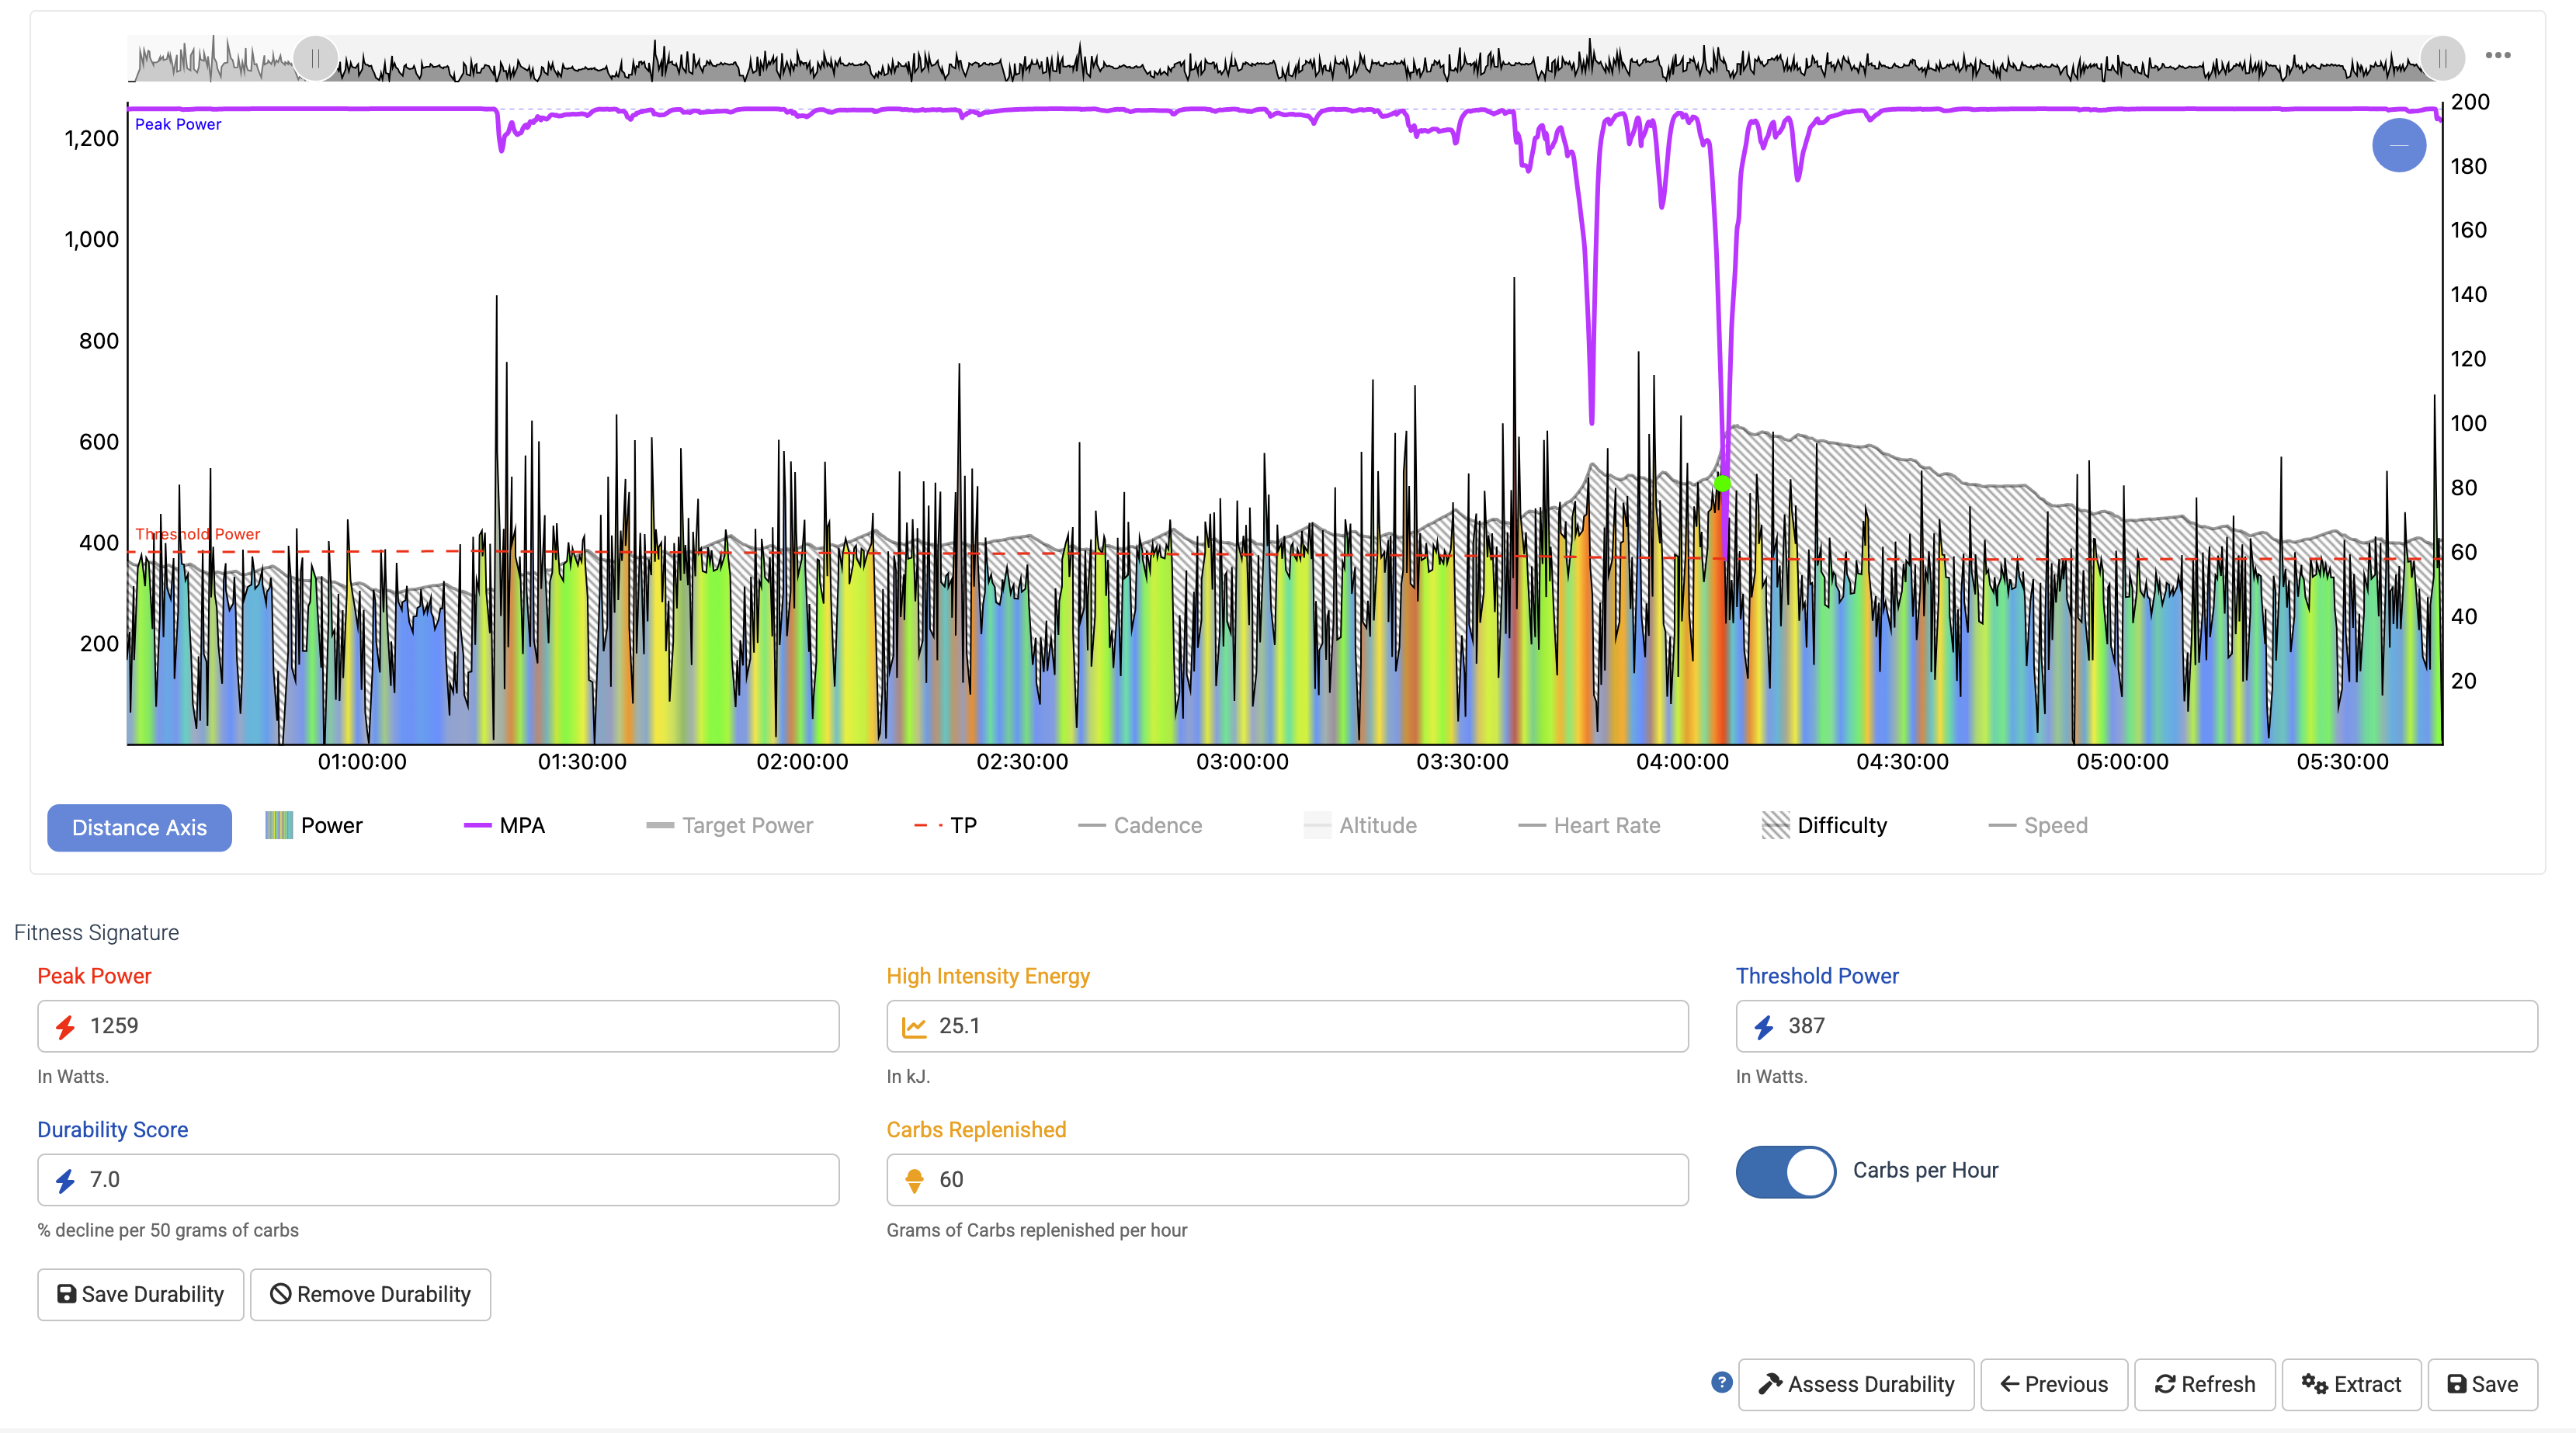
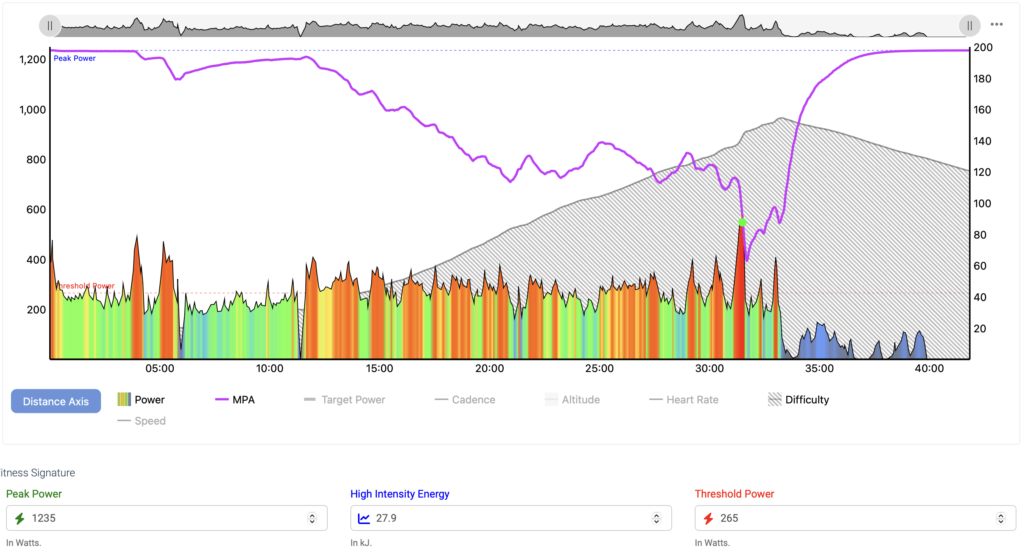
When you click Assess Durability, the system will calculate your Durability Metric, second-by-second over the course of the activity and associate a decline in your fitness signature as a function of this metric. The score is then shown as well as your fitness signature at each point in the activity. Simpy mouse over the TP line to see the signature at the point in time:

The MPA line we be noticeably different as it will now track your longer-term fatigue / slow-recovery fatigue / durability over the course of the ride. This type of fatigue does not recover during the ride and will require full rest. In most cases, this fatigue can be attributed to glycogen depletion, i.e. your energy stores needed for higher intensity have become depleted and your ability to sustain longer efforts above threshold are diminished. Indeed, your Threshold Power erodes during the course of the event/activity. You can see the effect of this by mousing over the TP line on the chart to see how your fitness signature changes.
How to Evaluate your Durability Score
Durablity Scores tend to range between 15% and under 5%, with 15% being untrained and under 5% being professional level. Club level well-trained athletes can be at 10% or lower. Those that win races will have better durability scores during these races as compared to their competition. Winners of professional races, for example, can combine the highest fitness signature values together with durability scores less than 2%. Indeed, those with better durability scores can outperform stronger athletes (those with a better fitness signature) but with weaker durability. Often a strategy of increasing the paces to impact durability of part of the strategy.
The concept of Durability has long been part of endurance sport. The word endurance itself is associated with durability, having the same etymology, being from Latin “indurare” which means to make hard.
When Xert was first developed, durability was part of the architecture. Looking at the original post on Fitness Signatures, published in December of 2014, we described the concept of “Slow Recovery Fatigue”. This is ostensibly durability. It describes how your power duration curve changes over the course of a very long event. We used this phenomenon to help define our concept of Lower Threshold Power. which became a core part of Xert. This was long before Zone 2 training became a fad … and now it’s Durability which has become quite prominent within training and coaching circles, especially at the elite and professional levels.
We had intended to make durability a feature in Xert for many years but always ran into challenges associated with the complexity of the computational requirements and the limitations due things like fueling times and rates, which is data that is not readily available. However, we eventually envisioned a way to make “slow recovery fatigue” i.e. “durability”, part of the system. This is the Durability Score feature.
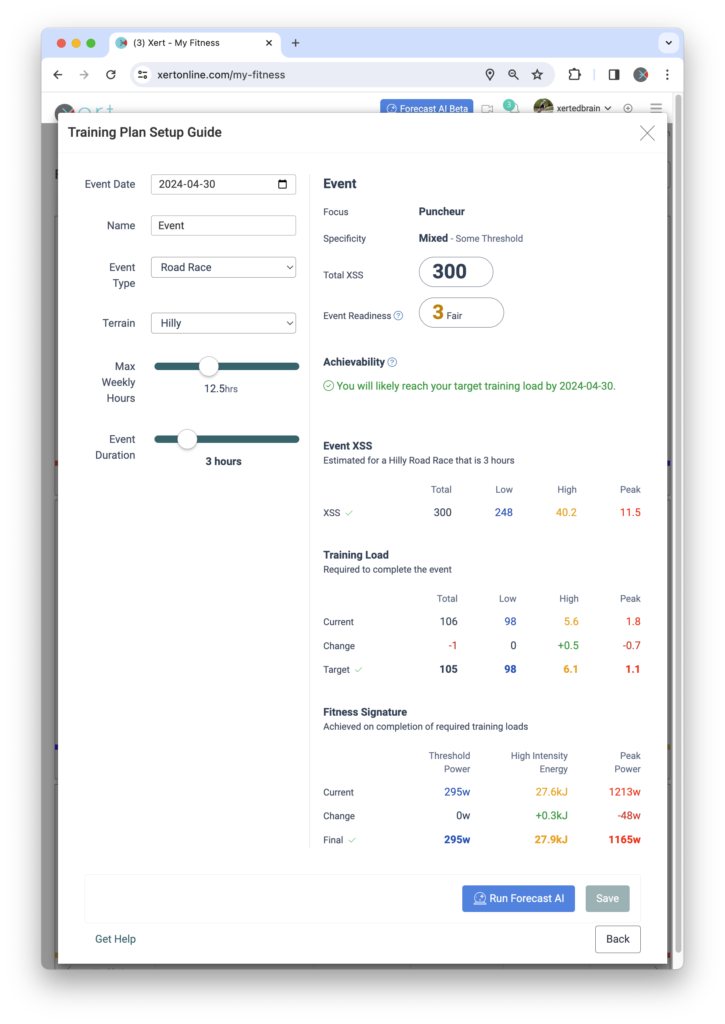
- Event Readiness
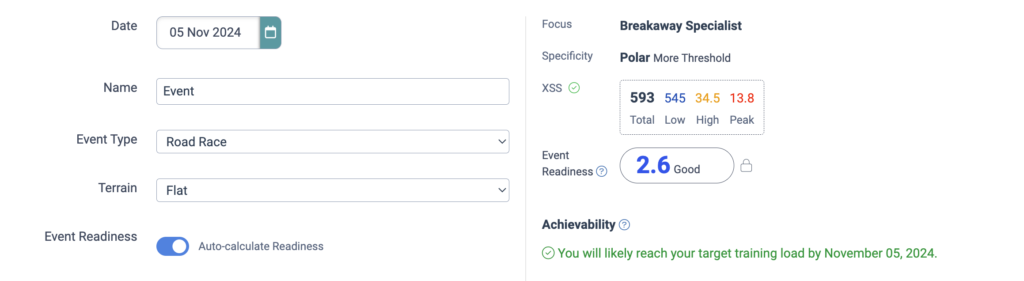
Being ready to complete an event has different meaning to different people depending on their overall goal. Some athletes want to be ready to win whereas others will want to be ready to just finish the event.
In Xert terms, how ready you are for an event depends on your training status and the demands of the event. Having greater readiness means that you can perform the event and suffer less degradation in performance during the event. Your durability to perform the event is higher when you have better readiness. For example, an athlete that has a 1 star training status (i.e. training roughly 3 hours per week) could complete a 8 hour event but they would reach a far higher level of event tiredness than an athlete that has a 5 star training status (i.e. training roughly 17.5 hours per week). Even if both athletes had the exact same fitness signature (power curve), the athlete with the higher training status is more ready for the event and will experience far less tiredness and fatigue both during and after the event.
Xert calculates Event Readiness at 5 levels:
Level
Description
1
Your readiness is Excellent and you’ll experience little fading performance during the event as well as not feeling very tired after the event. Your durability is very high and you’ll be fresh enough to race again the next day. This level is ideal for athletes that perform stage races or for athletes aiming to be at their very best for one-day races. 2
Your readiness is Good and you’ll experience some fading performance during the event as well as feeling tired after the event. Your durability is strong and you’ll be fresh enough to race again in a couple of days after the event. This level is ideal for athletes that are looking to optimize performance for a single day event without having to invest in a lot of weekly training hours. 3
Your readiness is Fair and you’ll experience fading performance during the event as well as feeling very tired after the event. Your durability is fair and you’ll be fresh enough to race again in about 3 of days of rest after the event. This level is ideal for athletes that are looking to perform well at the event while minimizing the time needed to prepare for it. 4
Your readiness is Poor and you’ll experience a high-degree of fading performance during the event as well as feeling extremely tired after the event. Your durability is poor and you’ll be fresh enough to race again with about 4 days of rest afterwards. This level is ok for athletes that are looking to get through the event with the least amount of preparation involved, either due to schedule constraints or the event is too close to enable enough of an increase in training loads. 5
You will not be ready for this event. The demands of this event are outside what you are capable of preparing for and should be avoided. The combination of the demands of the event, your current training status, the training status needed for the event and the amount of time you have to prepare for it make it unlikely you’ll be prepared enough to complete this event without considerable distress and overall fatigue. Advanced Conceptualization Example
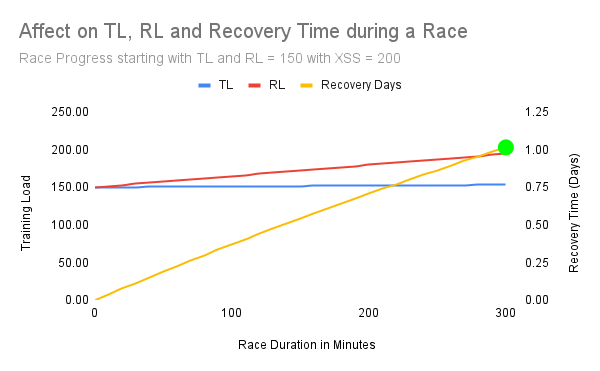
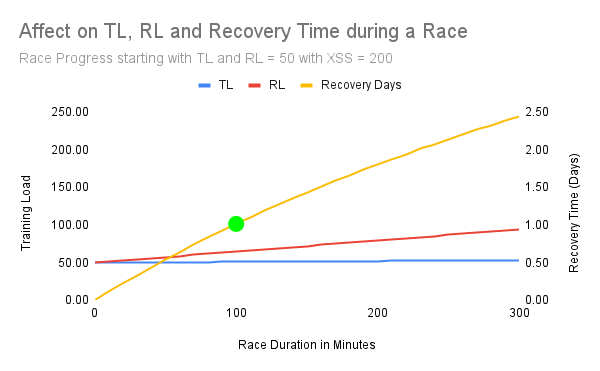
Imagine two cyclists, Cyclist A and B, both have the same fitness signature (i.e. the same power curve) and the same weight. Cyclist A is an accomplished cyclist and has been training all spring whereas Cyclist B is a talented junior that hasn’t yet had an opportunity to build up a lot of fitness. This would mean that if they both climbed a hill at the start of a race that was 5 minutes long, they could both ride it at the exact same pace and finish together (assuming the rode side-by-side all else being equal). But lets say they had to climb this hill many times during an event and at increasing levels of tiredness and fatigue. which of the two would be more ready to compete at this event? Answer: Cyclist A. Cyclist A would conceivably have greater training loads than Cyclist B. Say Cyclist A has been doing 5 minute hill repeats over and over and has built up a training load of 150. Cyclist B hasn’t had an opportunity to do much at all except for some base training and has a training load of 50. Cyclist A, by virtue of having done more hill repeats (and thus why their Training Loads are higher) would have greater durability for this event and would outperform Cyclist B who would not last as long as Cyclist A during the event. Cyclist A may not feel fatigue during the event and may recover in a day or two. Cyclist B will be trashed during the race and will need many days to recover back to form.
In the charts below, we can see that Cyclist A would finish the race with just 1 day to recover. Cyclist B would finish the race requiring 2.5 days to recover and will reach the same fatigue as Cyclist A one hour into the race. Note that both will have the same Form at the end of the race. Form can’t be used in this scenario. But Cyclist B will take longer to recover from that same Form value since they simply don’t have the same level fitness and durability as Cyclist A.
- Fatigue
Fatigue represents a reduction in an athlete’s ability to produce power. It either manifests as a reduction in Maximal Power Available (short-term fatigue) or a reduction in fitness signature values (long-term fatigue). Short-term fatigue recovers during an activity whereas long-term fatigue does not, or does so very slowly.
Two principles of fatigue are the foundation of Xert:
- Fatigue reduces power
- MPA is a real phenomenon. Although research has previously described the idea that power reduces with fatigue, Xert is the first model ever to quantify it during intermittent exercise and apply it for analysis and for training prescription.
- Fatigue increases strain (e.g. XSS)
- Fatigue makes riding more difficult and the closer you work to MPA, the greater the strain. Reaching your physical limits of power isn’t easy and the instances that these occur during exercise are infrequent and in many cases, avoided by athletes.
- Workouts like ‘SMART – Bangarang‘ and ‘SMART – Hammer to Fall – 90‘ use this concept of reducing MPA to provide a solid boost of low-intensity strain
- Fatigue reduces power
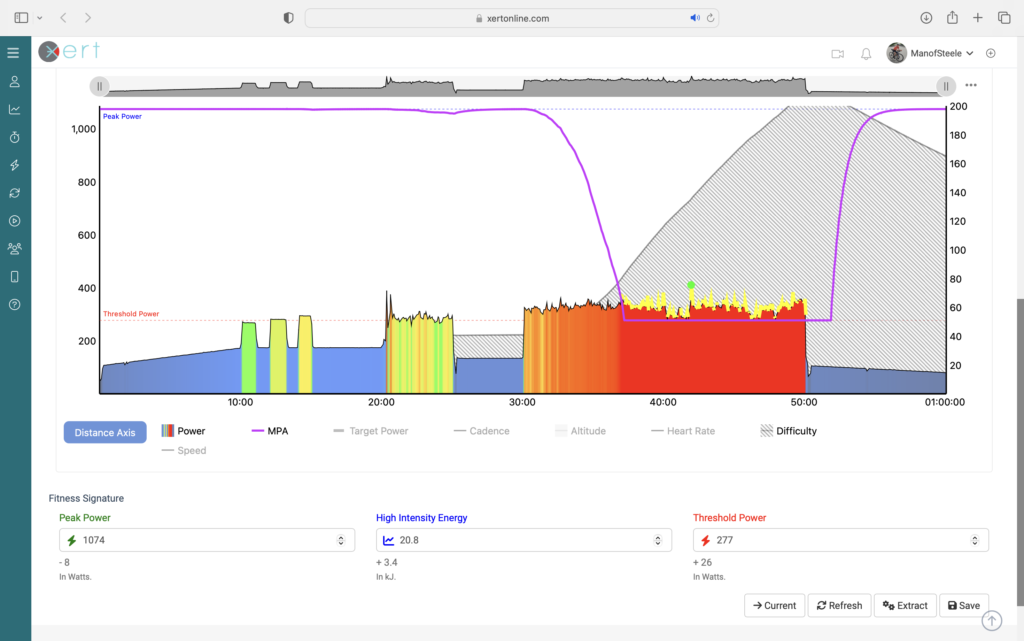
- Fitness Breakthrough
A fitness breakthrough is achieved when your power exceeds the Maximum Power Available predicted by Xert for your fitness signature and represents a maximal effort. Generally speaking, it will require you to surpass your MPA for at least 5 seconds during an activity. The longer you exceed MPA, the bigger the resulting fitness breakthrough will be.
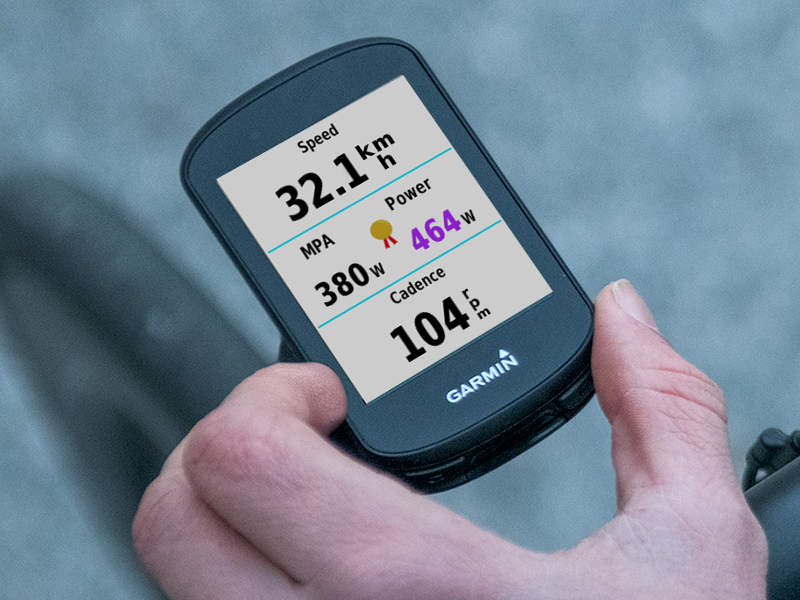
When a fitness breakthrough is seen in your data, your fitness signature is extracted and updated. Most of the time, if your breakthrough included moments where your power exceeded MPA, you receive a medal on your Garmin MPA or a breakthrough notification in Xert EBC. Depending on your effort, one or more of your Fitness Signature parameters may increase.
If you came very close but didn’t surpass your MPA, your Fitness Signature may decline. This is a near breakthrough, or colloquially a fakethrough.

To read more about Breakthroughs with Xert, check out our blog post, here.
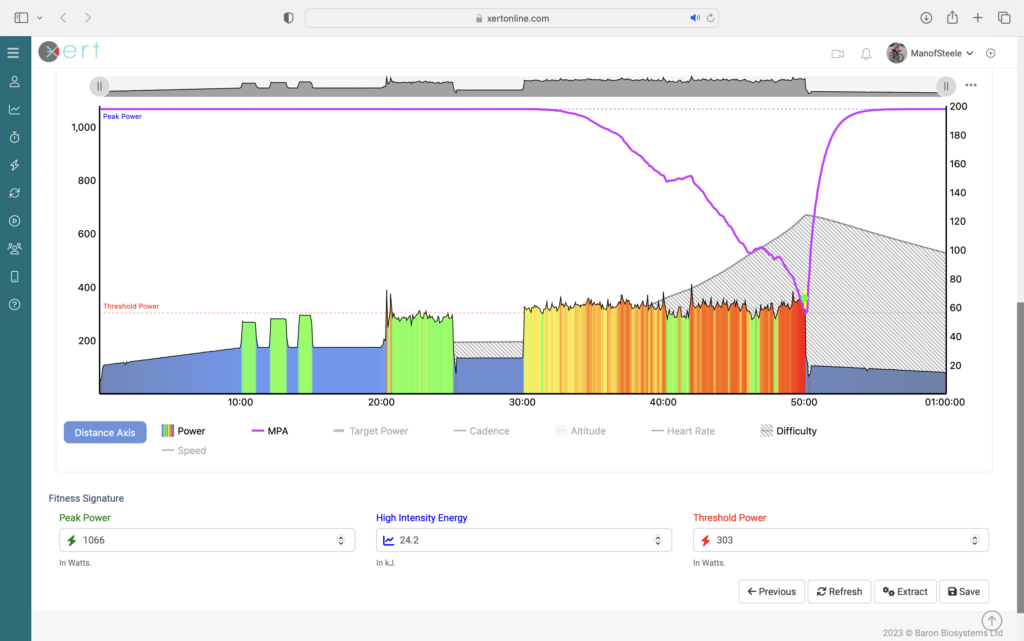
After a (near) breakthrough is detected, Xert re-calculates your MPA data using the NEW fitness signature… to visualize this, move the image slider below to the right. Clicking ‘Previous‘ at the bottom of the activity details page will show the MPA data using the starting/out-dated fitness signature – the MPA data should align with what you saw on your Garmin or EBC app during the ride… to visualize this, move the image slider to the left.
Learn how to share Workout & Breakthrough Reports on your Strava, here.
- Fitness Signature
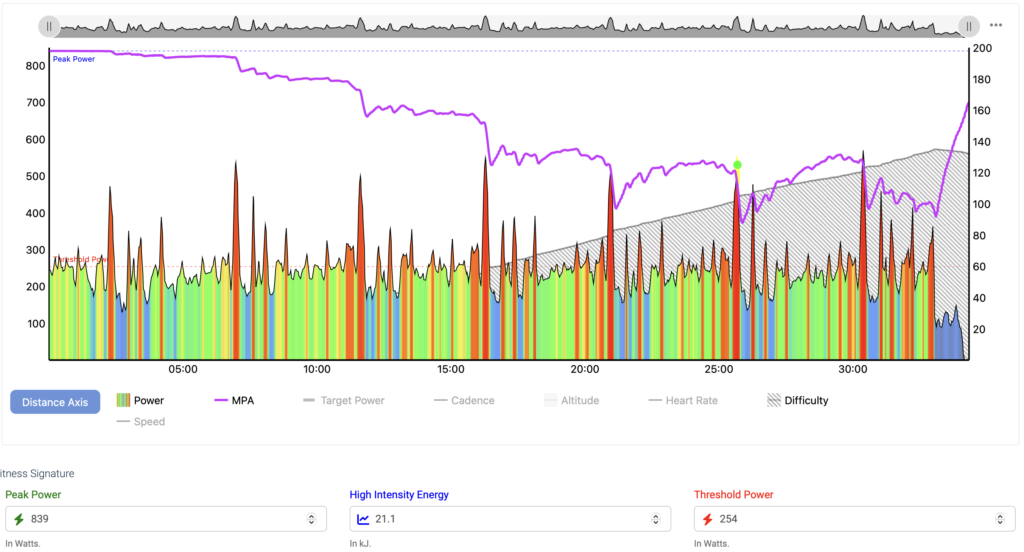
Your Fitness Signature is a set of three values that Xert uses to measure your unique fitness, almost like a ‘fitness fingerprint’. Each athlete’s fitness signature is comprised of: Threshold Power (TP), High Intensity Energy (HIE) and Peak Power (PP). Xert analyses all of your activities with power data, searching for maximal efforts and extracts these 3 values from your best efforts.
Xert uses your fitness signature values to calculate your Maximum Power Available (MPA) interactively on your activities (or for workouts). When you achieve a Fitness Breakthrough, Xert calculates the changes in your fitness signature that explain your breakthrough performance!
Your fitness signature is shown at the bottom of the page on each Activity Details page:
Your fitness signature can also be used to calculate your power-duration curve. In principle, your Fitness Signature establishes your ability to perform during steady-state or variable intensity power:
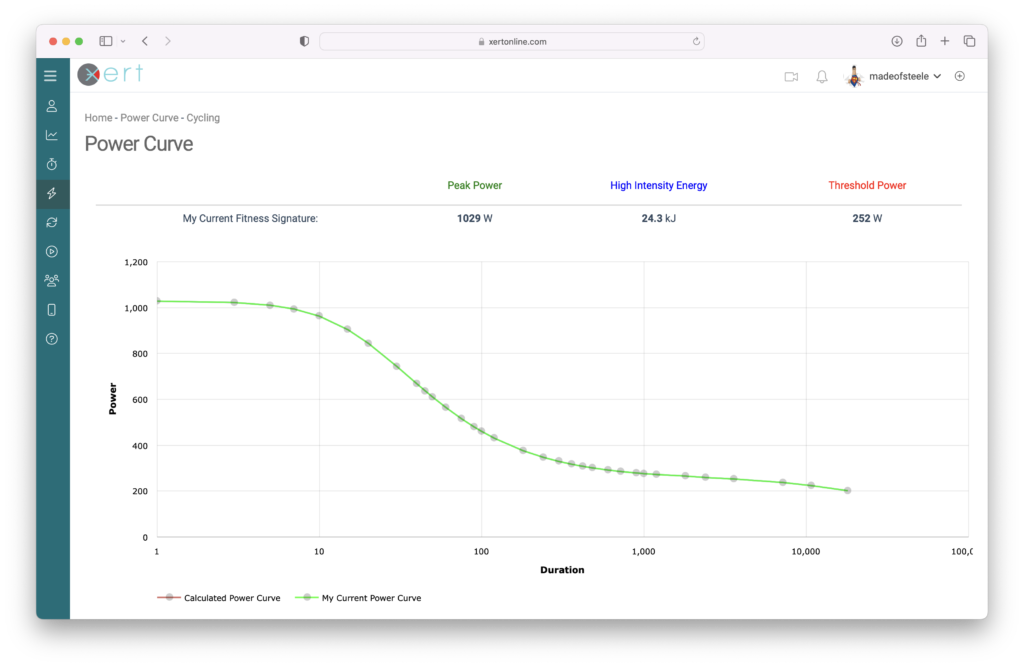
Your Fitness Signature is a foundational aspect of the Xert system.
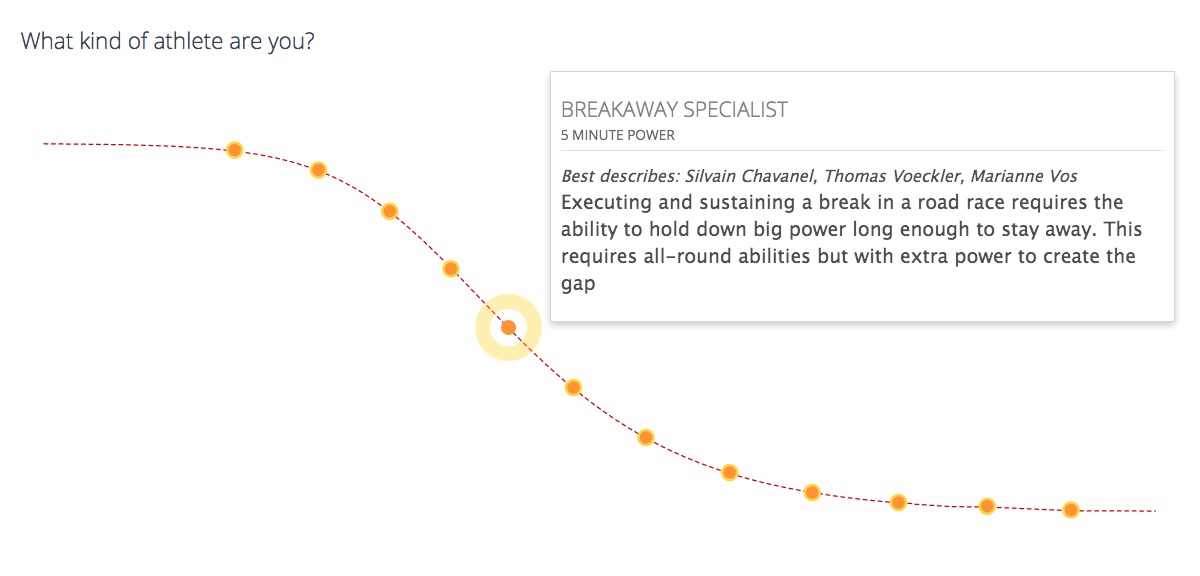
- Focus Duration
Focus Duration is used to help understand what a given activity, workout, or even your accumulated training, is focused on. You first get exposed to the concept of Focus Duration when you choose your Athlete Types during the Xert account profile setup process. Athlete Types correspond to a particular point on your power curve represented by a duration. For example, if the most you can sustain for 5 minutes before having to stop is 286W, 286W would represent your 5 minute power on your power curve. This power output would be classified as a Breakaway Specialist for you, as the value 5m 00s is closest to this Athlete Type. The highest power you could sustain for 8m 43s would be classified as a GC Specialist, and so on. Sprinters tend to have higher power over shorter durations and time-trialists tend to have higher power over longer durations.
An example of a Power Curve, highlighting 5 min power
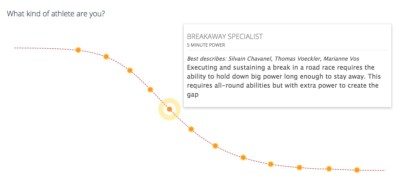
Athlete type for 5 min power
Fatigue is what defines the limits of performance. In Xert, the fatigue you encounter during exercise is governed by the three systems identified by your Fitness Signature. The work you do (and thus the strain you experience) must therefore be applied to these same three systems: low, high and peak. To understand how these three systems work together to deliver your performance, we look at their ratios (work contribution/allocation ratios ) to see how each contributes to your power output for a steady-state-effort-to-exhaustion of a given period (e.g. 6 minutes).
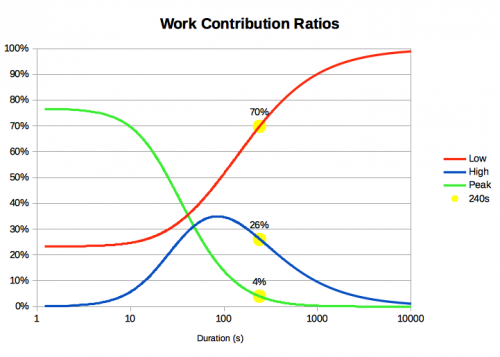
To conceptualize this, consider a workout with work intervals at 500W, and rest intervals at 0W in between. Whether the rest intervals were 10 seconds, 1 minute or even 10 minutes, you would characterize the workout to have a focus of 500W. If the rests in between were at 10W, the workout would still essentially be focused on your 500W power. However, if the rests in between increased to something like 150W, then you would conclude that the focus was partially 500W and partially 150W, i.e. some value in between. Xert calculates this for you and determines what this power value would be. This is Focus. Xert calculates this every second of your activity and adds them all together for an entire workout, activity or even a season.
To enable Focus to be interpreted the same for everyone (similar to how %FTP is meant to be the same for everyone), the Focus Power value is converted to a duration based on your power curve. So when you see on Xert that an activity/workout/training period has, say, a Focus of Rouleur (6 minute power) this means that the activity/workout/training period adds up to you having performed all the strain in the same ratio as that of your 6 minute power requires. If your 6 minute power is 300W, 6:00 was your Focus Duration.
You can think of this as being similar to %FTP and zones. But rather than giving you a zone and adding up how much time you spend in it, we identify how each of the three systems are in use for a given power output and add up all this strain into each of the three component systems. Comparing their ratios to those of your work allocations ratios for given power output, they translate to a Focus Duration. The shorter the focus duration, the higher the power (analogous to the higher zones). And the longer the focus duration, the lower the power (analogous to the lower zones). Xert bases training goals, classifies activities, defines workout intervals and plots your progression using this information.
To further refine Focus, we also use a calculation for Specificity Rating, which is a percentage. The higher the percentage the more time you spent near that Focus power. So if your Focus was 300W and your Specificity Rating was 100% (100% Pure), this would mean that all you did over the entire activity/workout would have been 300W intervals and nothing else. If your Specificity Rating was 50% (Mixed), you would have done some work over 300W and some below 300W such that the added up to a Focus of 300W. This is like the example we provided above with 500W and 150W intervals. If your Specificity Rating was a low percentage (Polar), this would mean that you had short hard efforts and long sustained efforts which amounted to the same Focus. A low percentage means you spent the majority of time below your Threshold Power.
For information on how to understand the Focus Target provided by the Adaptive Training Advisor, consult the FAQ on this topic.
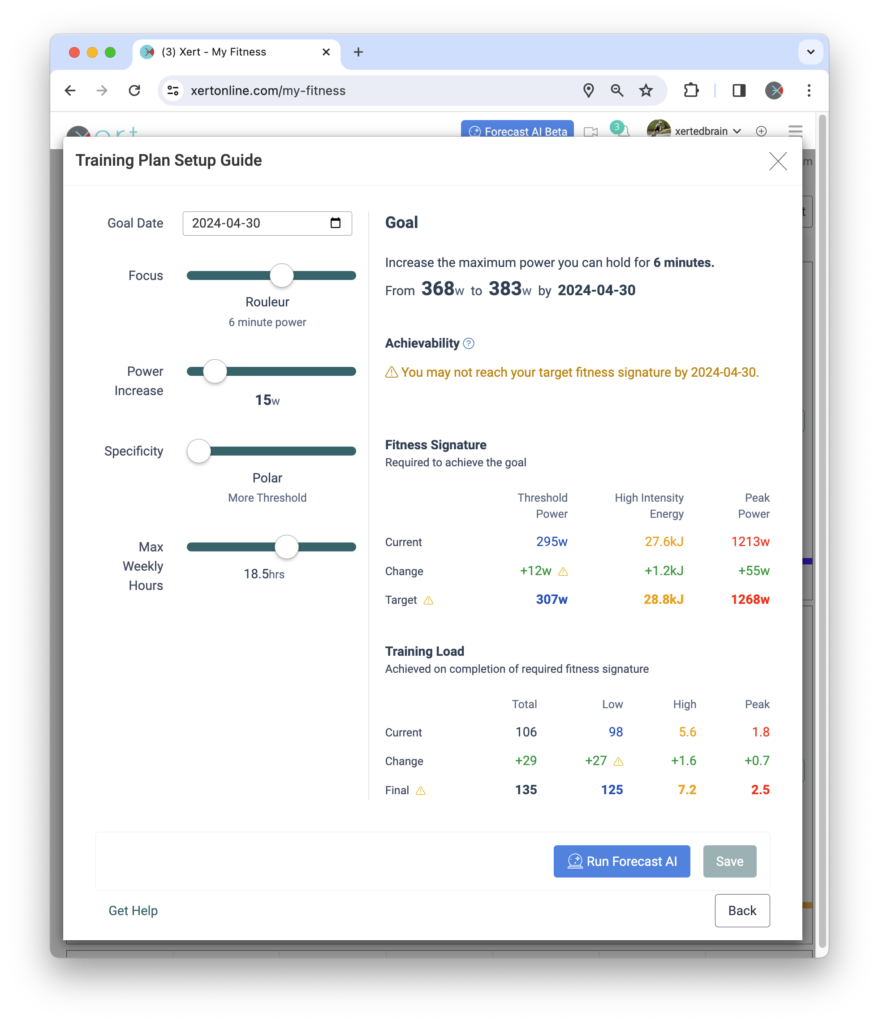
- Focus Power
Focus Power is the highest sustainable power you can possibly achieve for a given amount of time, just like mean maximal power (MMP) from the workout designer. Your Focus Power is calculated from your fitness signature – that is your Threshold Power, High Intensity Energy, & Peak Power. Focus Power can also be used to establish goals that Xert uses to calculate your necessary training. Focus Power is most meaningful for efforts that utilize all 3 energy systems, meaning efforts that are <10 min in length.
Focus Power & Focus Duration go hand-in-hand… Focus Power allows Xert to take a relative training target for all athletes (e.g. 5 min power) and apply it to your unique fitness signature, whatever your specific 5 min power is. Conversely, it allows athletes of various fitness levels to compare their efforts on a universal scale.
Xert uses Athlete Types to classify different Focus Power efforts, from 10s power out to longer efforts.
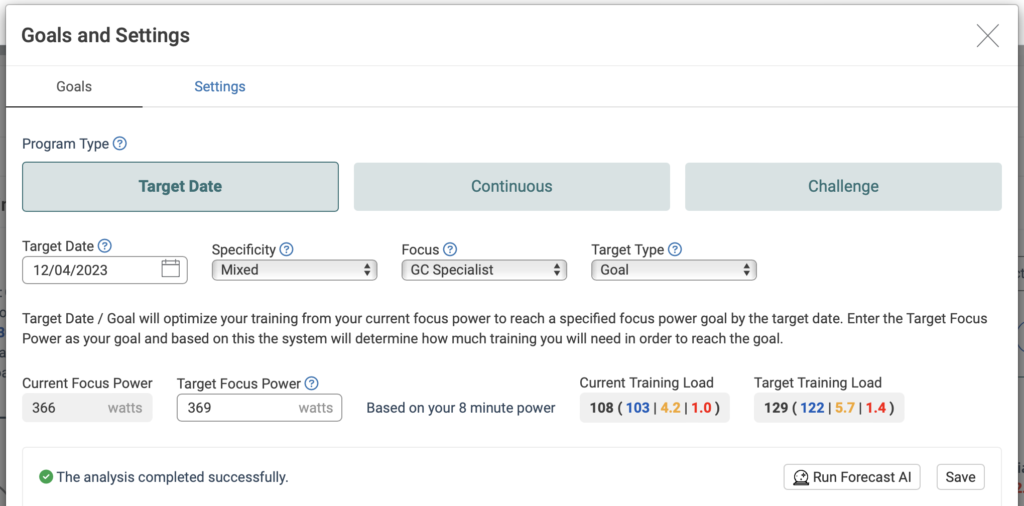
Athlete Type Duration Power Sprinter 10 sec Power Road Sprinter 2 min Power Pursuiter 3 min Power Puncheur 4 min Power Breakaway Specialist 5 min Power Rouleur 6 min Power GC Specialist 8 min Power Climber 10 min Power You can create a Power Target Goal by choosing the ‘Goal‘ option under Target Date program type and entering a date for when you’d like to achieve your goal. Next, select the Athlete Type that corresponds with your desired goal (e.g. Breakaway Specialist = 5 min power), and enter in your target Focus Power. Your current Focus Power is displayed using your current fitness signature, to help you with setting a new goal. As you enter a Focus Power goal, Xert will estimate the training load(s) that will be required to achieve that Focus Power.
Note: If the goal is too aggressive, you might see the Focus Power text in red, indicating that your goal likely wouldn’t be possible to achieve in the given amount of time.
You can use the power of Xert to plan out the training required to meet your goal! Follow the training, and you should be on your way to achieving your goal!
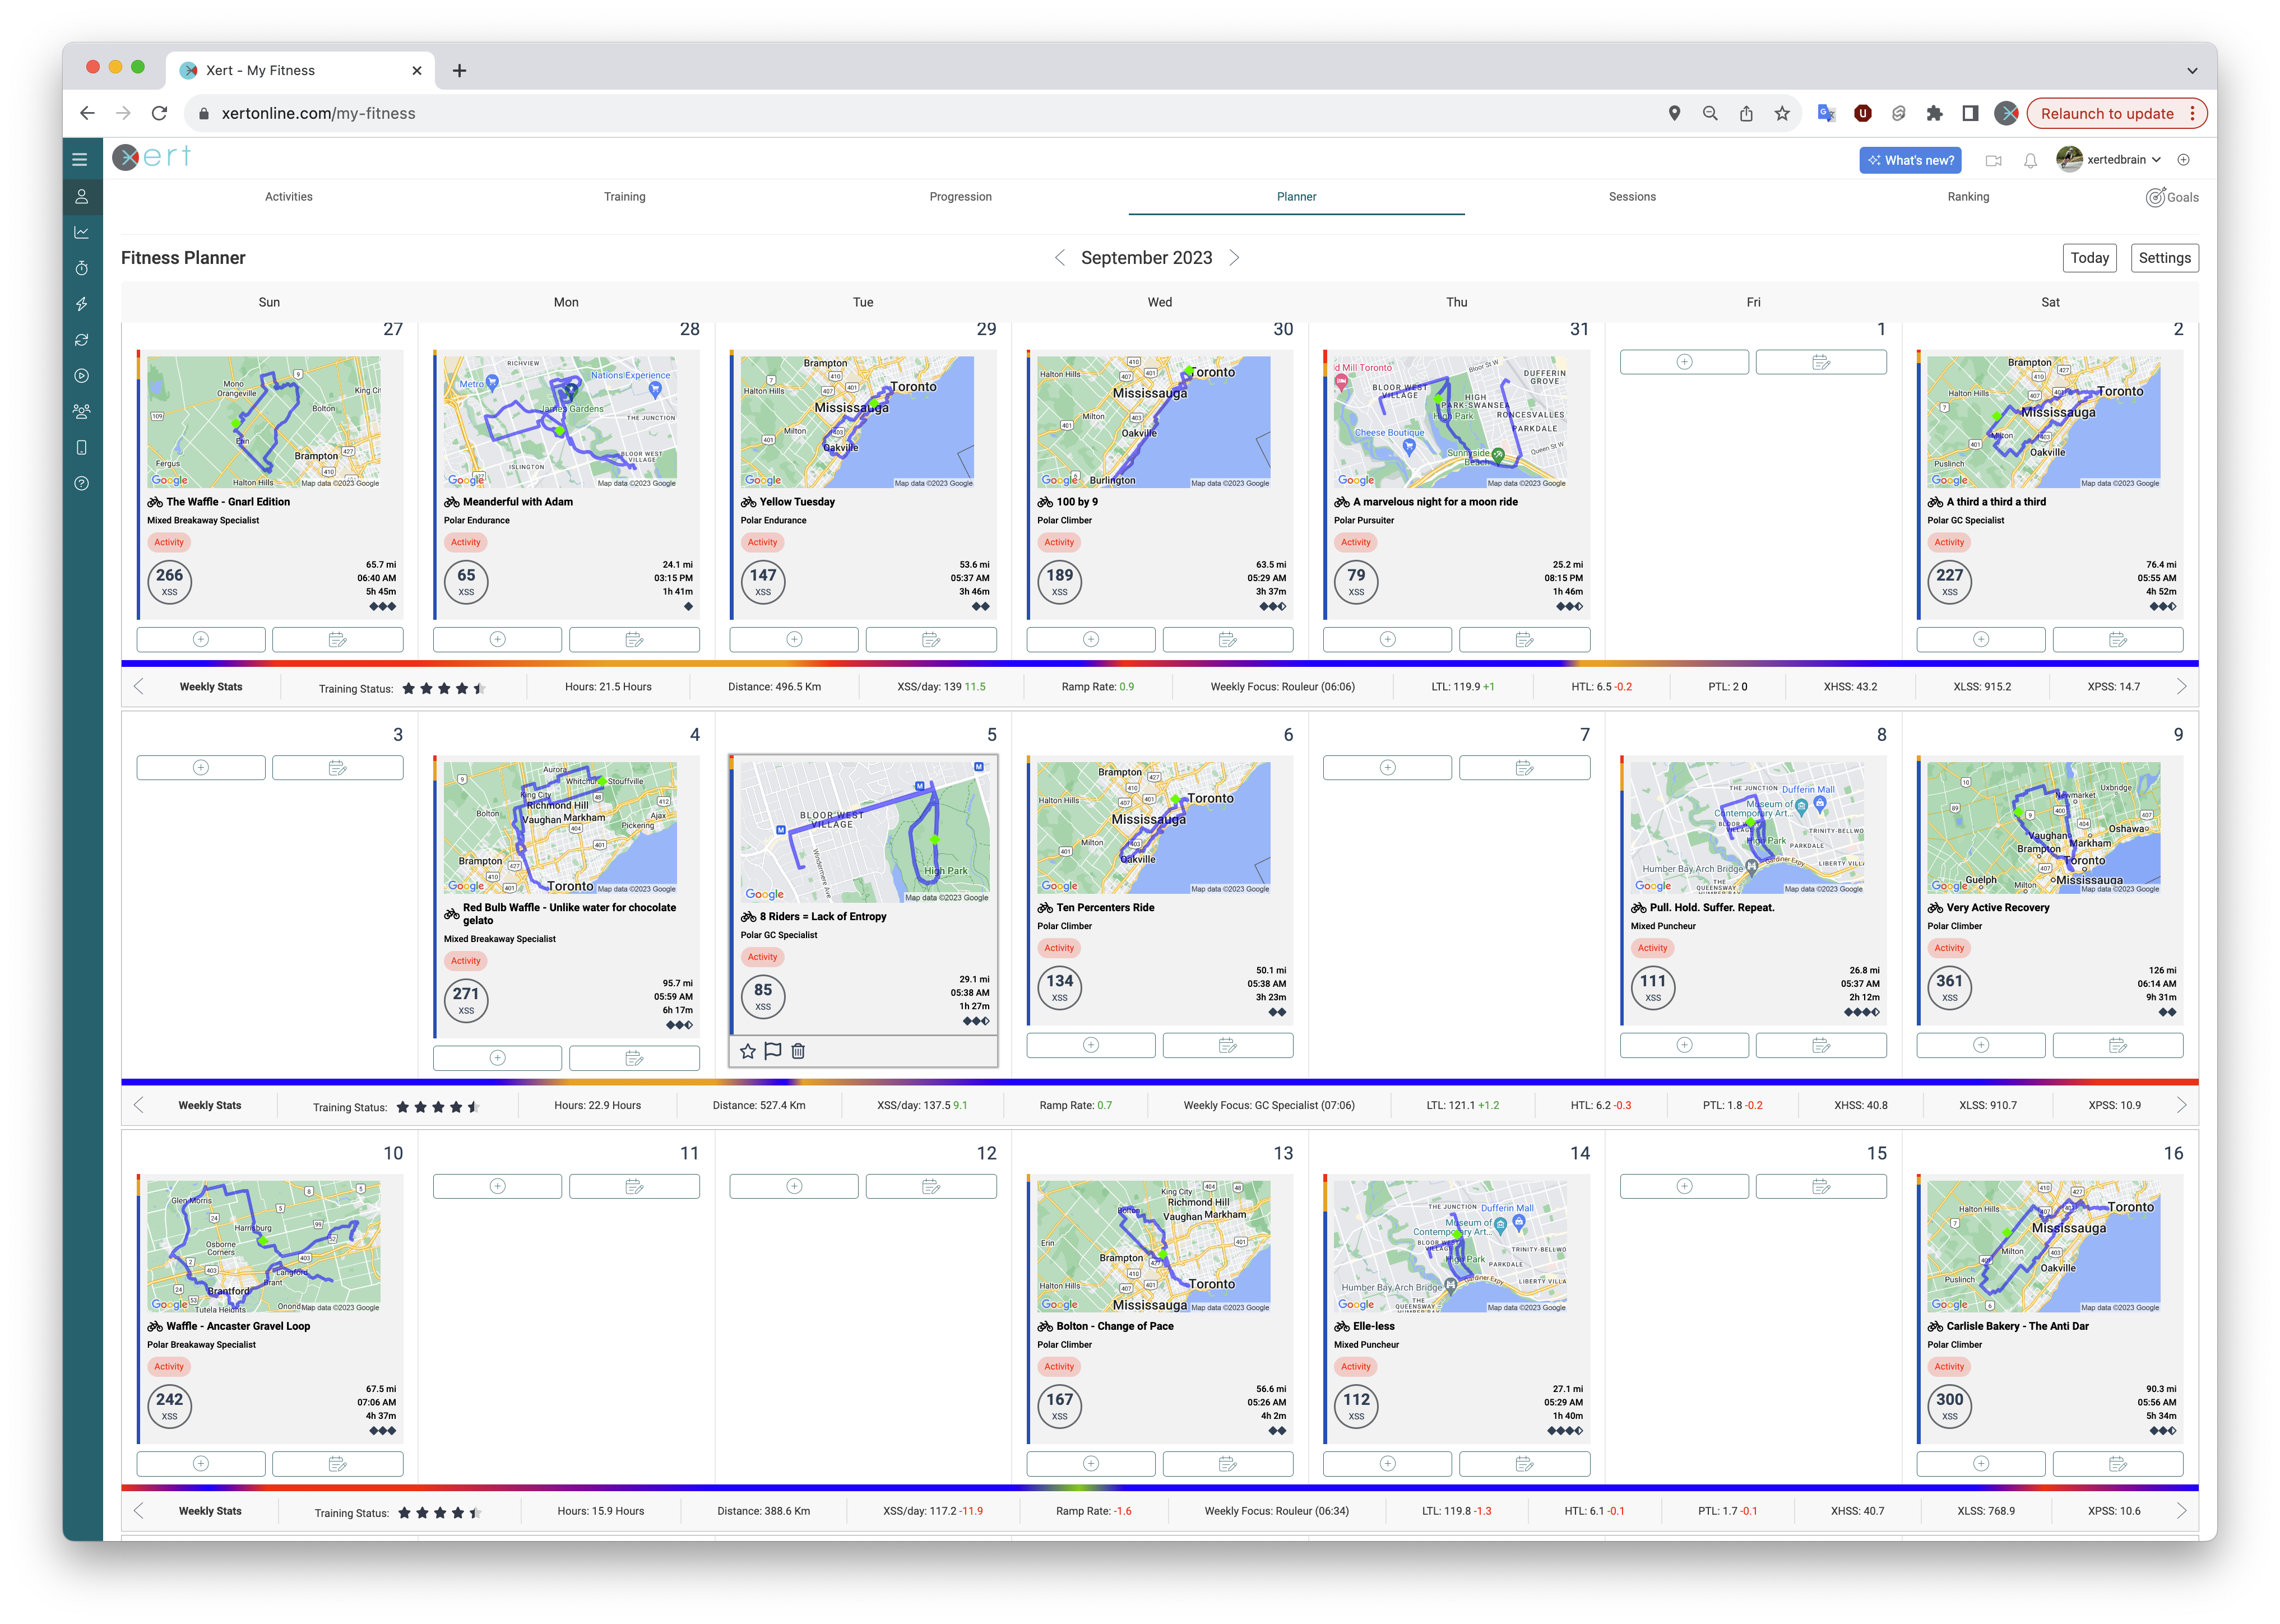
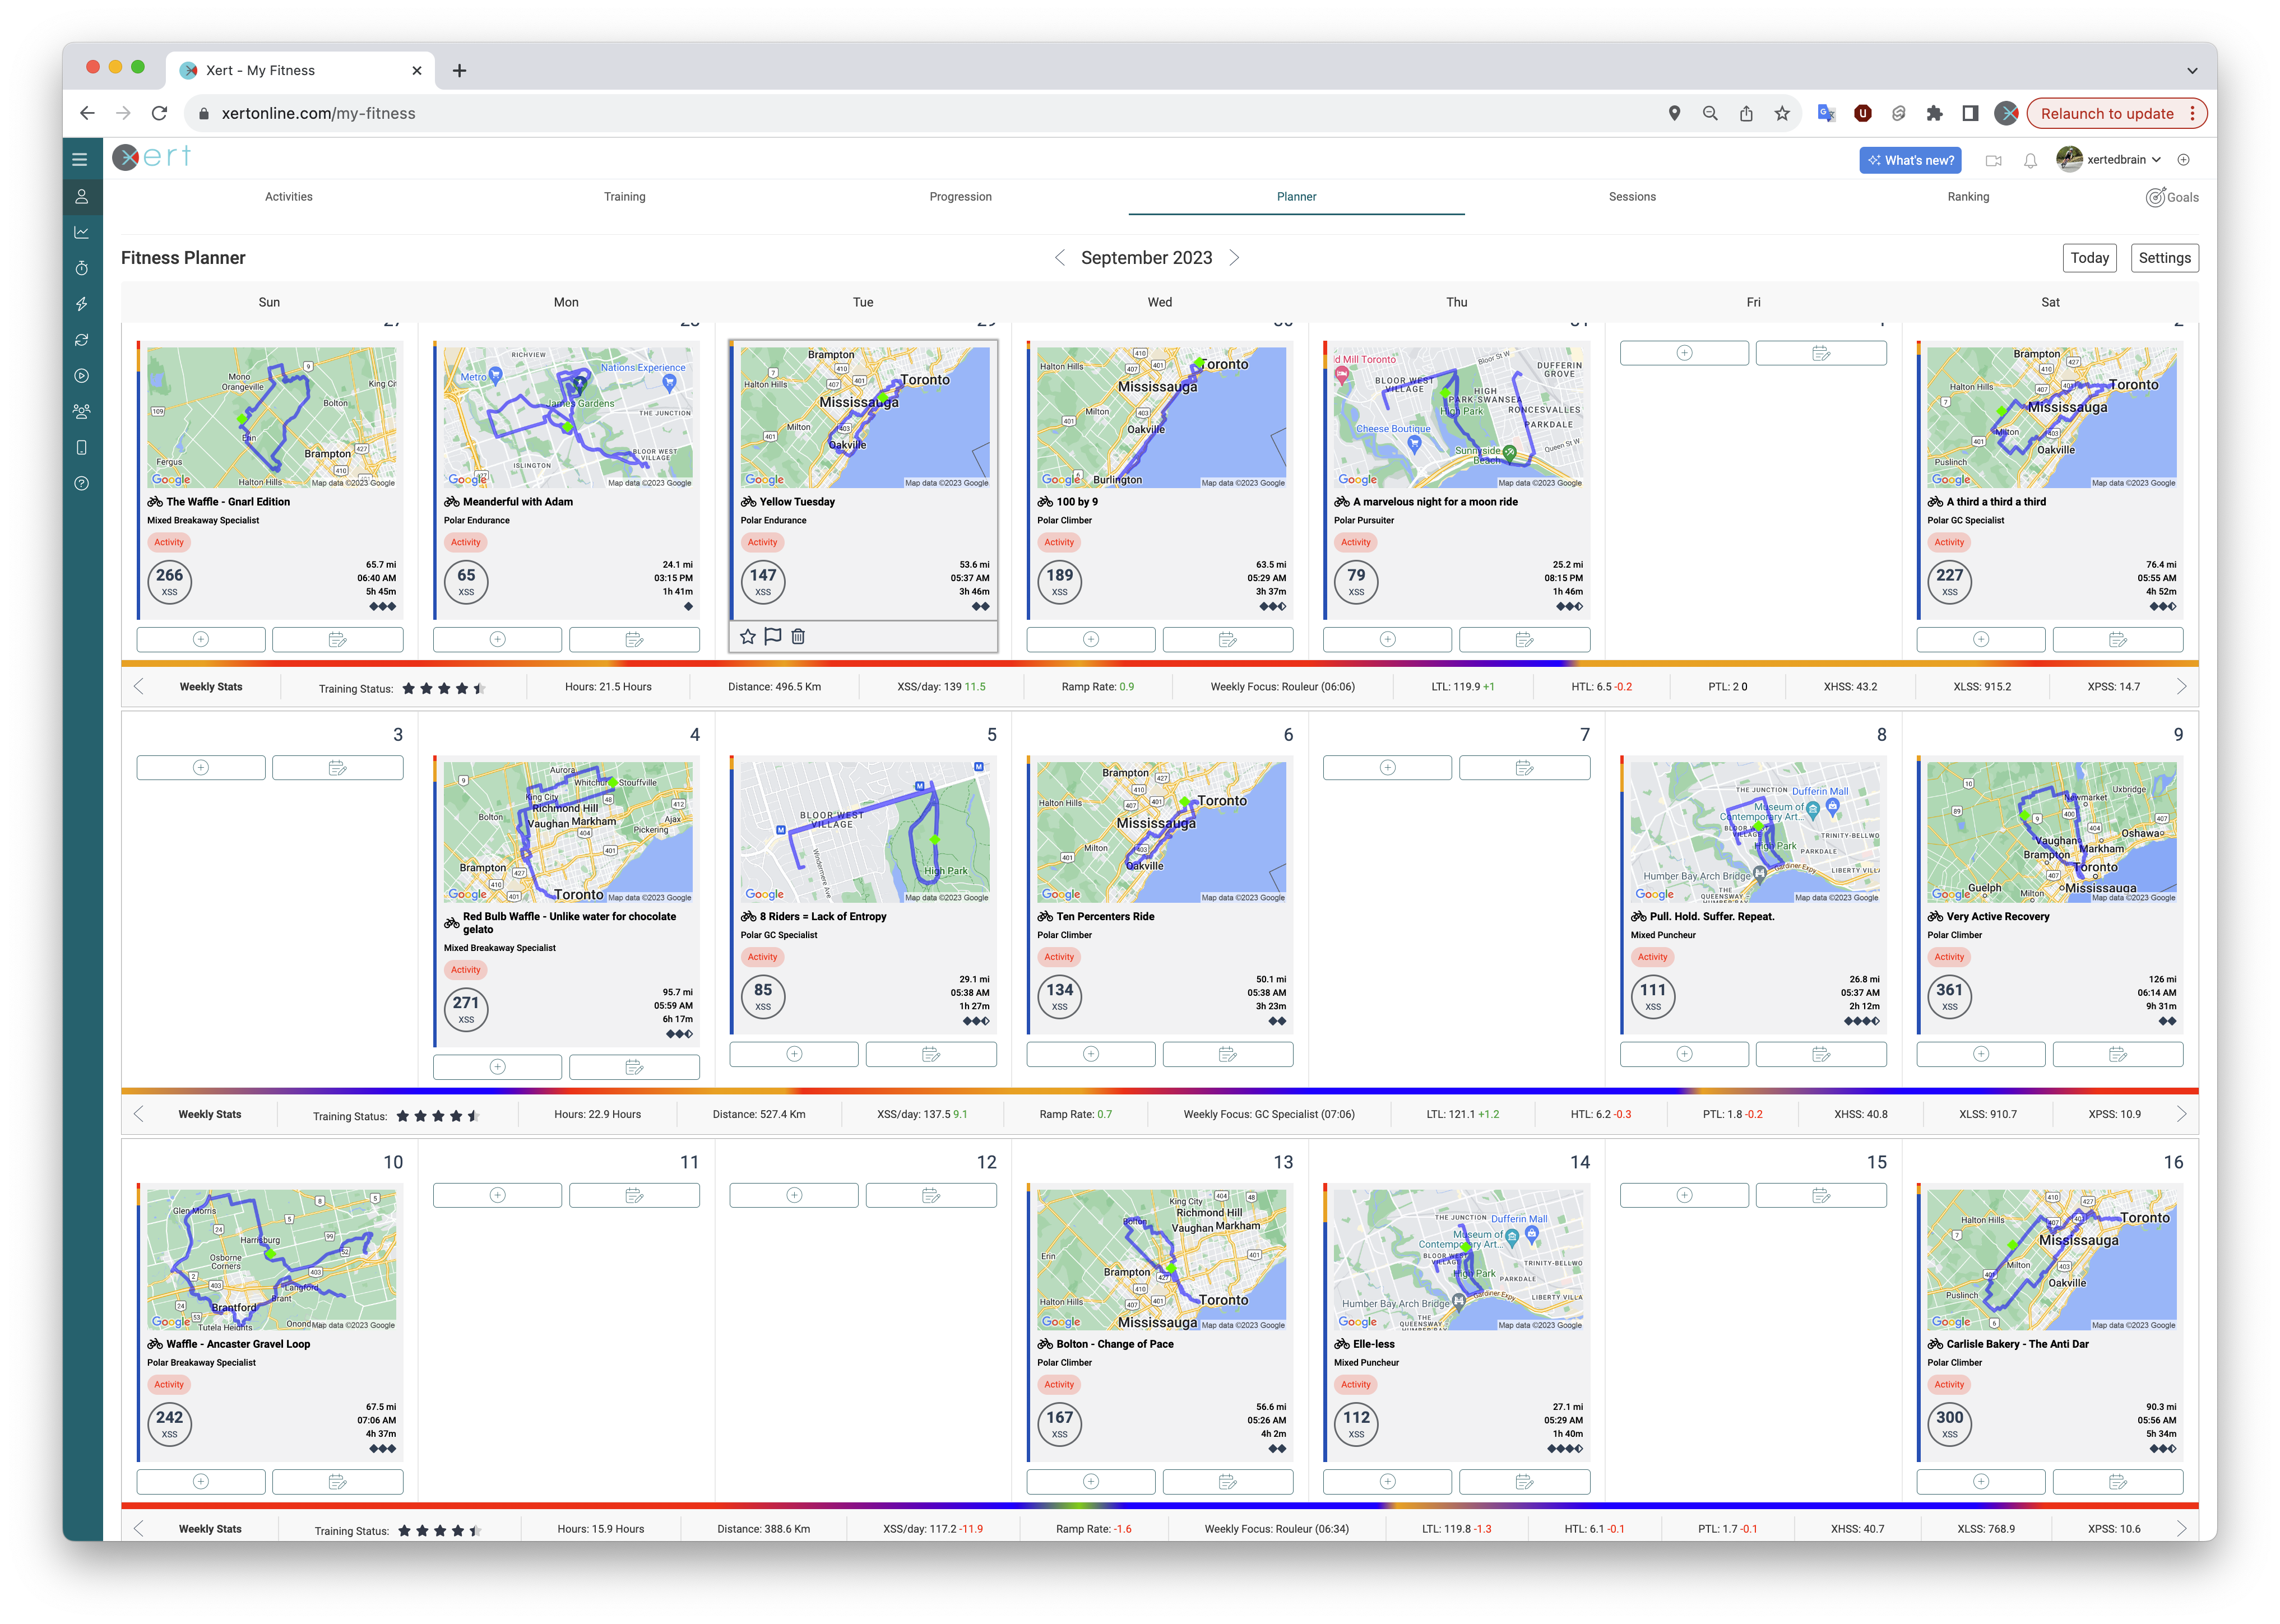
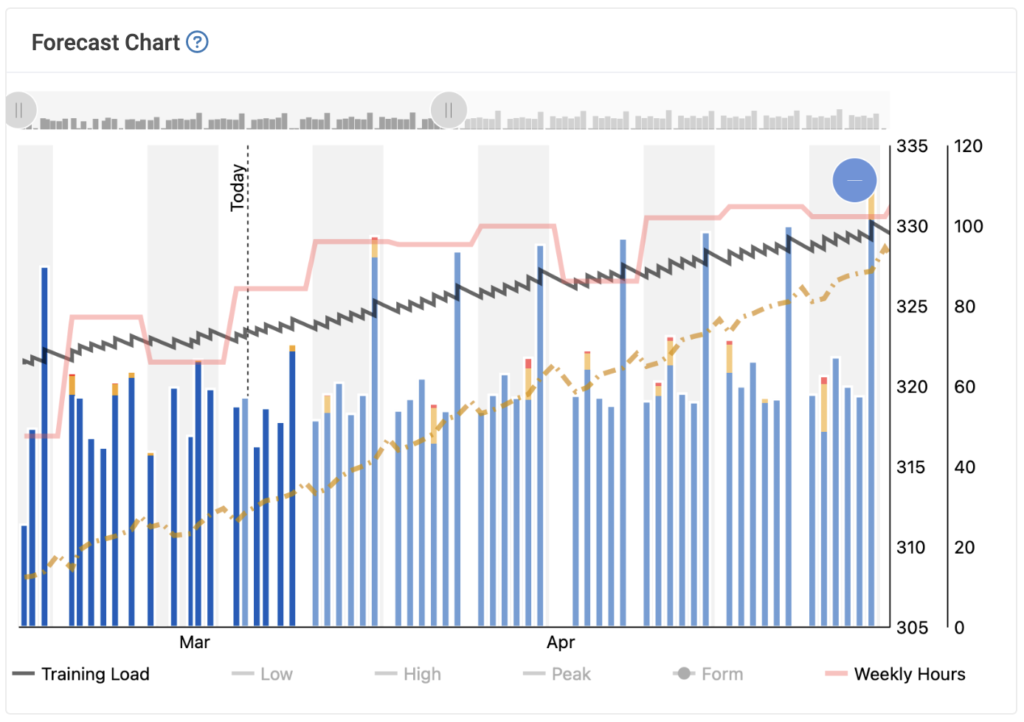
- Forecast Chart
The forecast chart displays your projected training towards your Target Event or Goal at a quick glance. Hovering over various aspects of the forecast chart will also reflect information about your training load, estimated weekly training time, form & focus power.
- Form
This is determined by the formula Training Load – Recovery Load. It is colour-coded on the XPMC chart according to the Fresh-Tired scale used on Training Status and Form. It is analogous to Training Stress Balance or TSB used in the Banister Impulse Response Model.
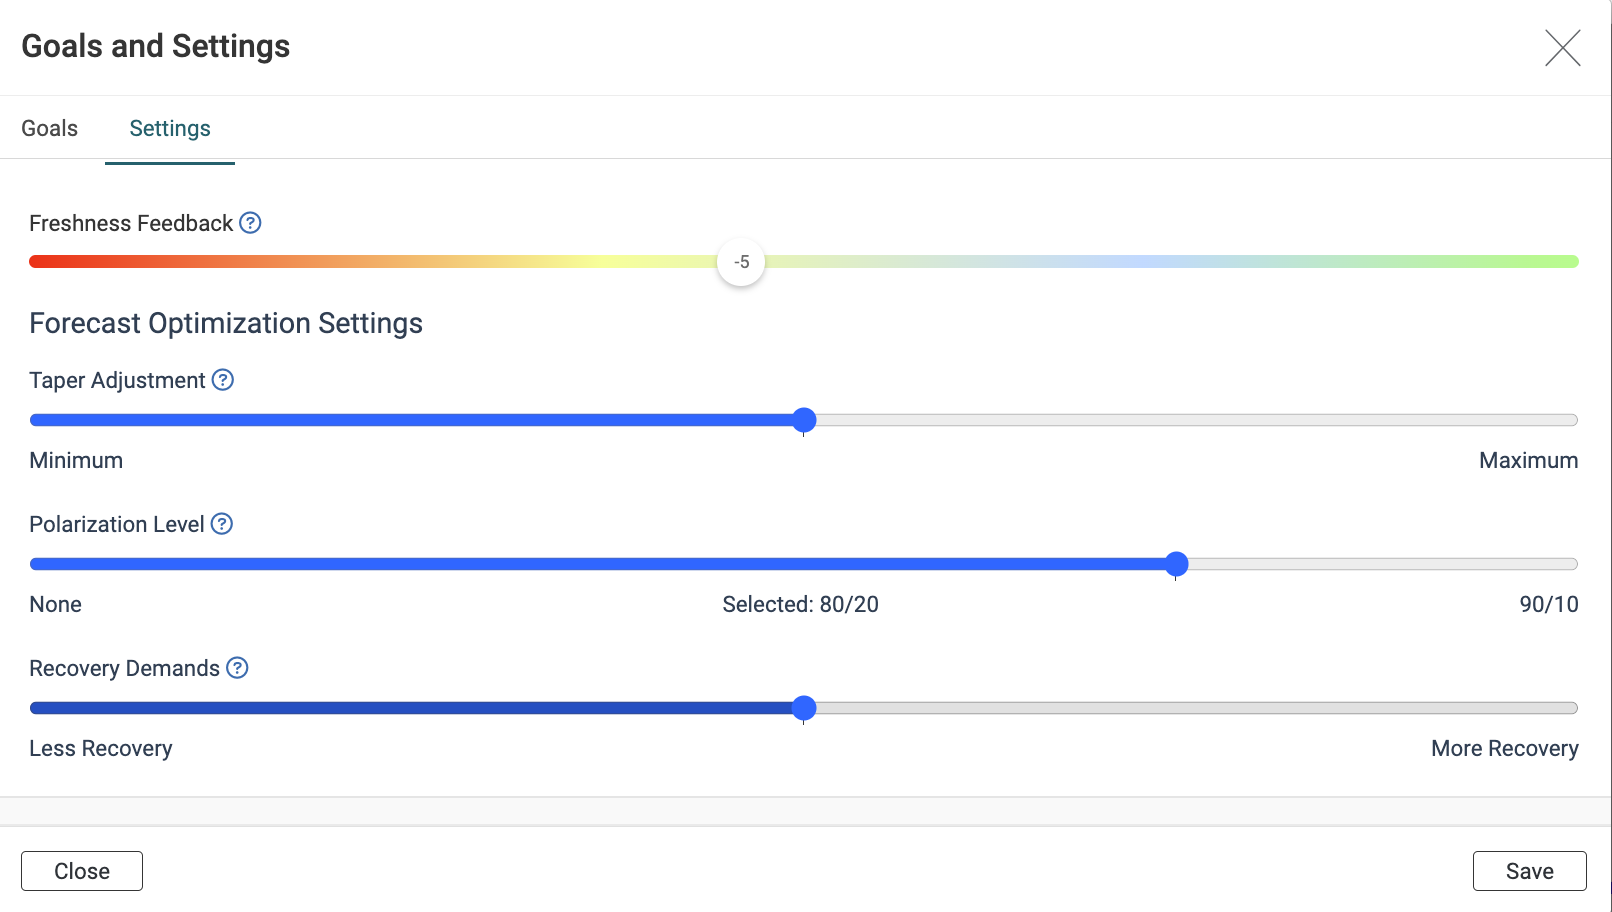
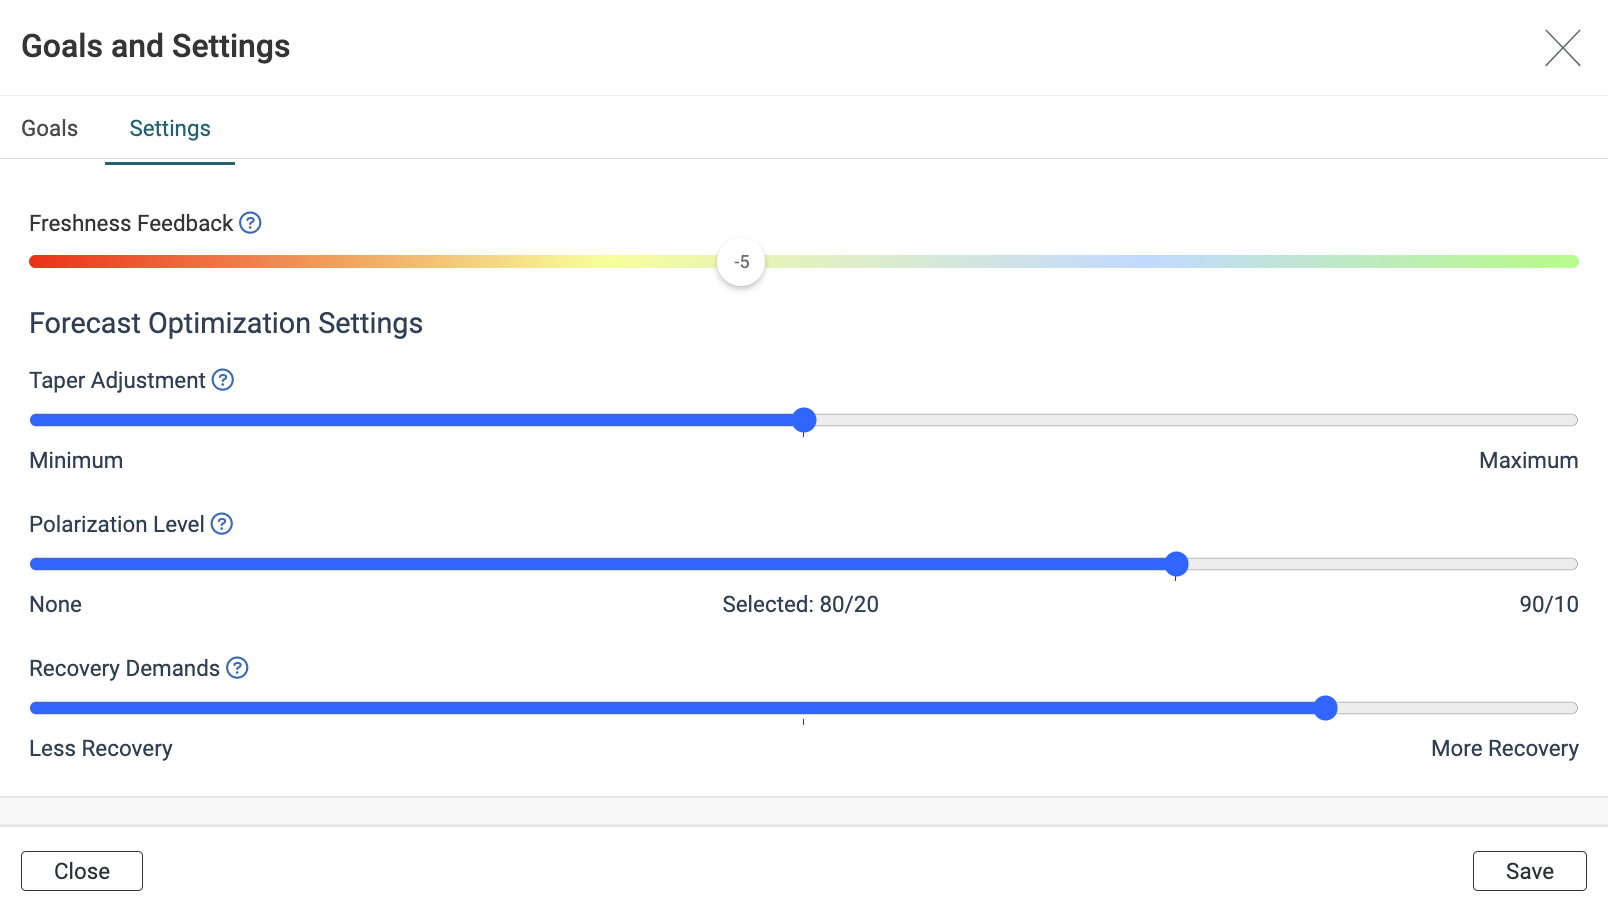
- Freshness Feedback
The Freshness Feedback slider allows you to fine-tune Xert’s freshness algorithm by providing personal feedback that reflects how you are feeling. This input helps the Adaptive Training Advisor (XATA) determine your readiness for high-intensity training and adjust the workout difficulty accordingly. You can find the Freshness Feedback slider in the Training tab, located underneath the Adaptive Training Advisor and Training Pacer gauge:
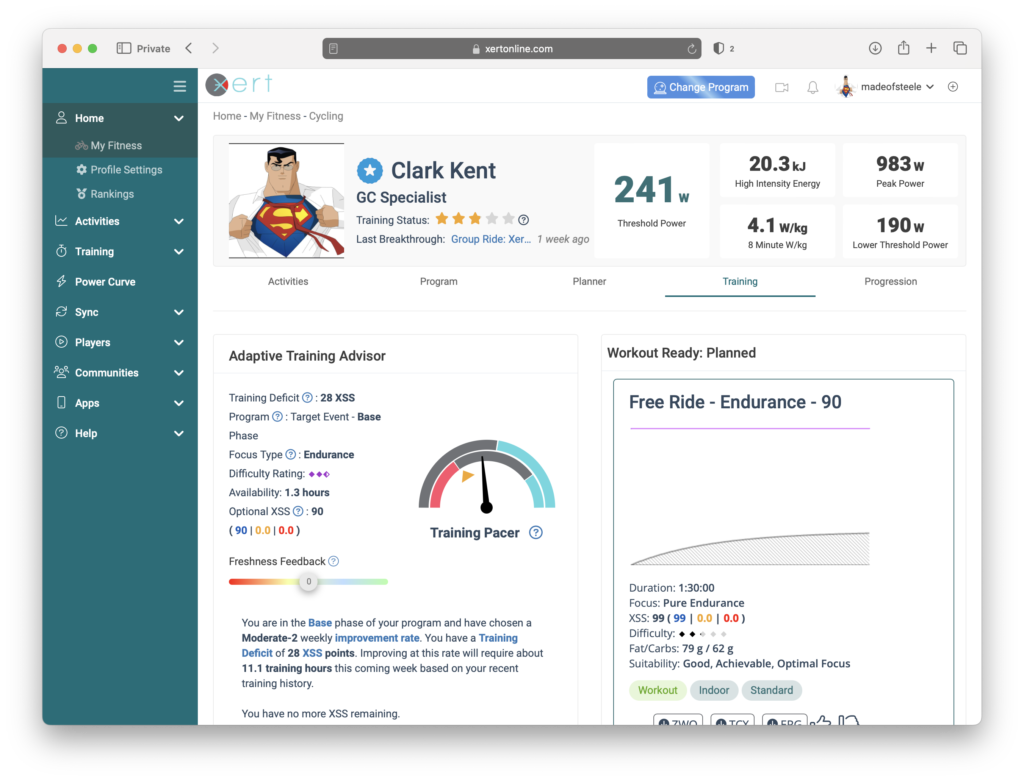
The slider’s range extends from -60 to +60, affecting your current overall Form. For instance, if you set your Freshness Feedback to +10, your Form will increase by 10, indicating greater freshness in your Training Status data. Consequently, the Difficulty Score used by XATA to recommend workouts will also rise by 10.
Conversely, if you adjust your Freshness Feedback to -10, your Form will decrease by 10, signaling to the system that you’re less fresh than previously assessed. As a result, the Difficulty Score for workout recommendations will drop by 10.
Important Note: Freshness Feedback only applies to XATA programs. The new XFAI programs do not utilize Freshness Feedback. For XFAI programs, users should select the workout they feel comfortable doing for the day and adapt their program afterward.
This slider impacts only today’s training recommendations. To manage how the system calculates day-to-day freshness, use the Recovery Demands slider.
For more details, continue reading here.
- FTP
Also referred to as Functional Threshold Power, it is the exercise intensity at which lactate begins to accumulate beyond steady-state levels. It is often considered by athletes as the maximum power that can be sustained for an hour, however the duration at which an athlete can ride at FTP typically varies between 40 and 70 minutes.
In Xert, Threshold Power closely matches that of FTP. In general, for most athletes, Threshold Power is slightly above FTP. Inspecting a power-duration curve using the Xert Fitness Signature calculator reveals the difference. Here’s an example:
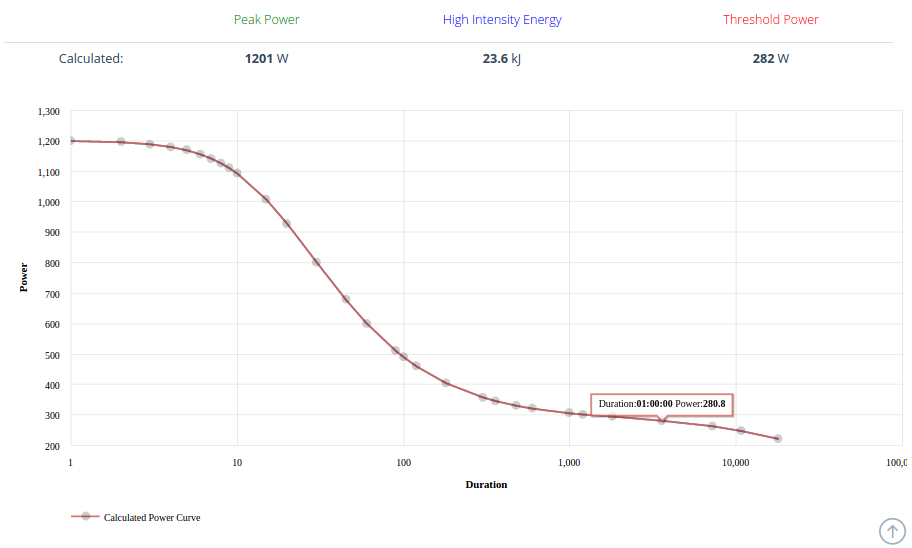
Here we have FTP = 280.8 watts and Threshold Power = 282 watts.
- Group Training Communities
Group Training Communities are a new way to socialize and train with the Xert platform. By joining one of the group training communities, you’ll be able to join & participate in group sessions with other Xert users. By the way, did we mention this new feature is completely FREE? Group training has many benefits, including increased accountability and the ability to complete more challenging workouts.
Joining a Group Training Community
To join a Group Training Community, head to the Sessions Page and select the ‘Group Training Community’ button in the top right-hand corner. From there, you can select from 6 different training communities. You will find options for training plans that are 4 hours/week or 6 hours/week. Group training plans are available for Sprinters, Attackers, & All-Rounders.

After selecting your Group Training Program, you will see the available workout times for that training plan. Note that each community has slightly different workout times. Select the time slot that works best for you and press the ‘Schedule’ button to schedule your training plan!
Xert Group Sessions
After you’ve selected your training plan, you will see the upcoming sessions that are part of your training plan, as well as other Public sessions that you can choose to participate in. You will automatically be joined to all group training sessions at your selected time by the Virtual Coach. If you wish to leave a particular session, click the ‘Joined’ button on the right-hand side. To join another Public Group Session, click on ‘Join Session’ option.

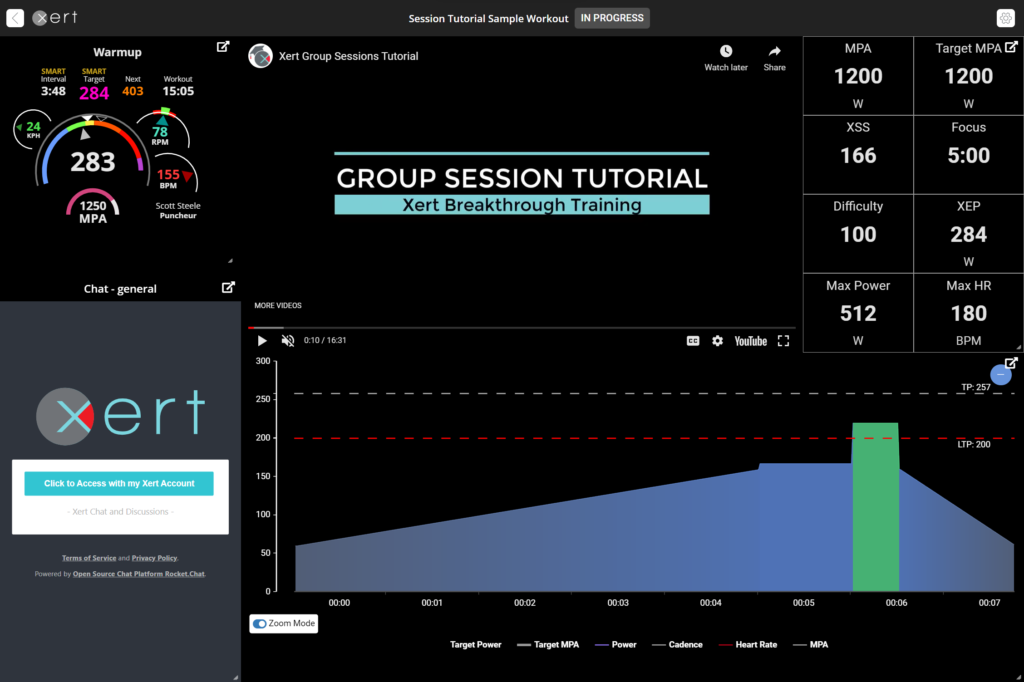
Participating in Group Sessions
Not sure what what equipment you need or what to do when your group session is coming up? Click on the image below to view the Xert Group Session Tutorial with Scott & learn how to set up and participate with your Group Training Community!
- Hardness
Hardness is a new performance concept introduced with Xert that provides a way to measure an athlete’s ability to endure discomfort. It is determined via a Hardness Test. There are 16 levels. The Hardness Tests use a similar workout pattern but increment total XSS for the workout, whereby Level 2 generates 63 XSS in one hour and Level 16 generates 200 XSS in one hour, with each level incrementing the total XSS by 10 XSS points. Hardness tests are based entirely on XSSR intervals.
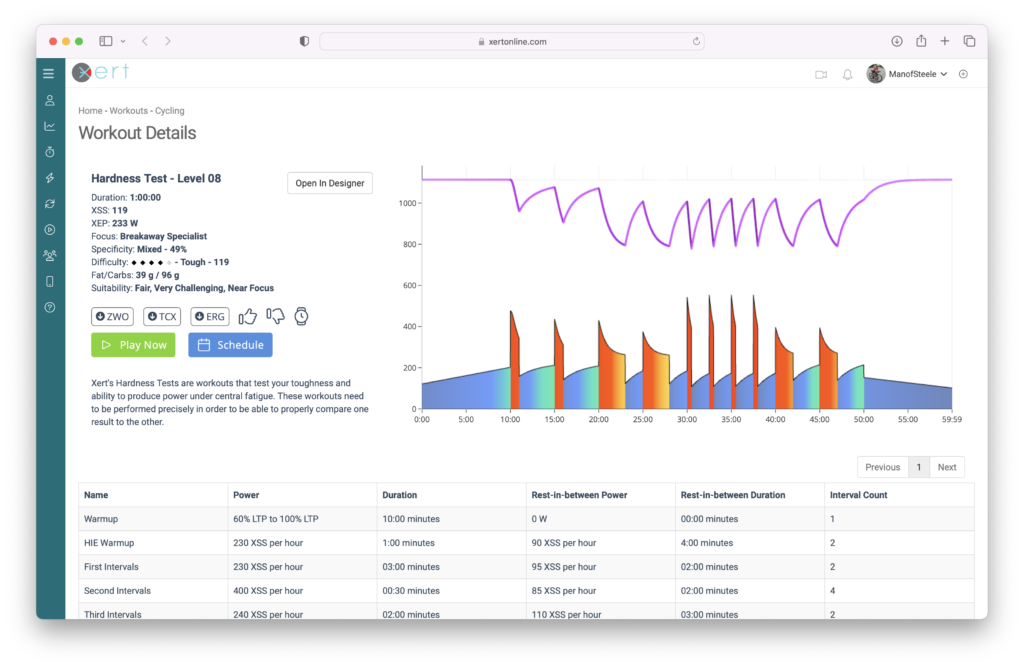
Hardness Tests add more strain (at a higher difficulty rating) without bringing the athlete to a point-of-failure – i.e. without having power reaching MPA. Each workout gets harder and harder, in effect, without forcing the athlete to have to stop. Stopping is voluntary.
- Heart Rate Derived Metrics
Many athletes often engage in activities without using a power meter, such as commutes, rides on second bikes, or while traveling and renting a bike. In these cases, it’s essential to wear a heart rate monitor, and preferably a cadence sensor, to ensure accurate tracking of your performance.
Enabling HRDM
To enable Heart Rate Derived Metrics, navigate to Home > Profile Settings and click on the General tab. On the right-hand side, you’ll find the options for HRDM:

When activated, this feature estimates various important metrics based on your heart rate and cadence data, including:
- Xert Strain Score (XSS)
- Average Power
- Xert Equivalent Power (XEP)
- Focus Duration
- Specificity Rating
- Estimated Fat and Carb Utilization
- Difficulty Score
How HRDM Works
HRDM analyzes your historical data to identify patterns between power, heart rate, and cadence. Once these relationships are established, any activity that includes heart rate or both heart rate and cadence will be analyzed. Using a cadence sensor alongside heart rate data provides a more accurate estimate of your fatigue level, as it accounts for periods of stopping, slowing down, and accelerating. This combination enhances the estimation of all the above metrics.
Please note that HRDM metrics are only calculated for activities lacking power data. If power data is present in an activity, the system will rely solely on that data, disregarding heart rate or cadence information.
To further refine the algorithm to reflect your current resting and maximum heart rate values, disable the Auto-estimate Heart Rate parameters and manually input your resting and maximum heart rate.
- HIE
- High Intensity Energy
High Intensity Energy, also used as the acronym HIE, this is the amount of energy or work capacity an athlete has above Threshold Power (TP). HIE is analogous in many ways to the term W’ used in sports science research, which has also been referred to as Anaerobic Work Capacity (AWC) in the past. HIE is measured in kilojoules (kJ). The most notable difference between HIE and W’ is that HIE can never be completely depleted. During exercise, HIE depletes when work is performed above Threshold and replenishes during rest or when work is performed below TP. At Threshold, HIE remains unchanged.
For example, if your HIE is 20 kJ, after performing 500 seconds at 10 watts above TP, your HIE would be reduced by 500*10 joules or 5kJ, i.e. 15kJ.
HIE is used together with TP and Peak Power (which together form your Fitness Signature) in Xert to calculate MPA, second-by-second.
It is also important to note that mathematically-speaking, MPA limits how quickly HIE can be depleted. Further, the value of HIE determines an athlete’s MPA in real-time. As HIE is utilized while riding above threshold, MPA simultaneously decreases. As HIE is replenished while recovering below TP, MPA also recovers towards Peak Power.
- HRDM
- Improvement Rate
The Improvement Rate is a crucial component of Xert’s Adaptive Training Advisor engine, indicating the pace at which you aim to increase your overall training load. A higher Improvement Rate necessitates more training volume and intensity, serving as the foundation for progressive overload in your training regimen.
You can adjust your Improvement Rate by modifying settings in the Program tab of your Xert account:
The Improvement Rate values range from Off-Season to Extreme-2 and correspond to specific weekly XSS ramp rates, as outlined below:
Improvement Rate Weekly XSS Ramp Rate Description Off-Season -2 The Off-Season Improvement Rate can be used during times when you are intentionally looking to decrease your Training Load in preparation for an increase in training in the future. Switching to Off-Season can help you recover from a long period of training and give your mind and body a rest before getting into a more intense training regimen. Taper -1 This is the rate to choose once you’ve reached your goal and would like to maintain your fitness a week before your event and ensure you are appropriately recovered. Maintenance 0 This is the rate to choose once you’ve reached your goal and would like to maintain that level of fitness and performance. Slow 1 Generally used for blocks where you’re wanting to ease into your training period without a large time investment. Moderate 2 / 3 This choice enables a balance of higher intensity and volume with consistent recovery, enabling this improvement rate to be sustainable over longer blocks of training. Aggressive 1/2 4 / 5 An aggressive improvement rate can offer an opportunity to generate a great increase in your training load and fitness levels for a 3-4 week block. When training is executed precisely, it should be followed by a rest week to regain sufficient freshness before starting the next block of hard training. Extreme 1/2 6 / 7 Extreme levels offer an opportunity for high overloading and are great as a short term boost before your taper. Requiring both an increase in time and intensity, use these sparingly throughout the training calendar as they quickly lead to fatigue, requiring additional recovery. - Intensity Ratio
Intensity Ratio represents the total amount of strain above threshold power to the total amount strain below threshold power. It looks at your work/strain allocation ratios for the strain you accumulate during training to establish the follow ratio:
low strain : (peak strain + high strain)
For example, according to this chart, representing the work allocation for a 4 minute Puncheur Focus with Pure Specificity rating, the polarity ratio is 70:30.
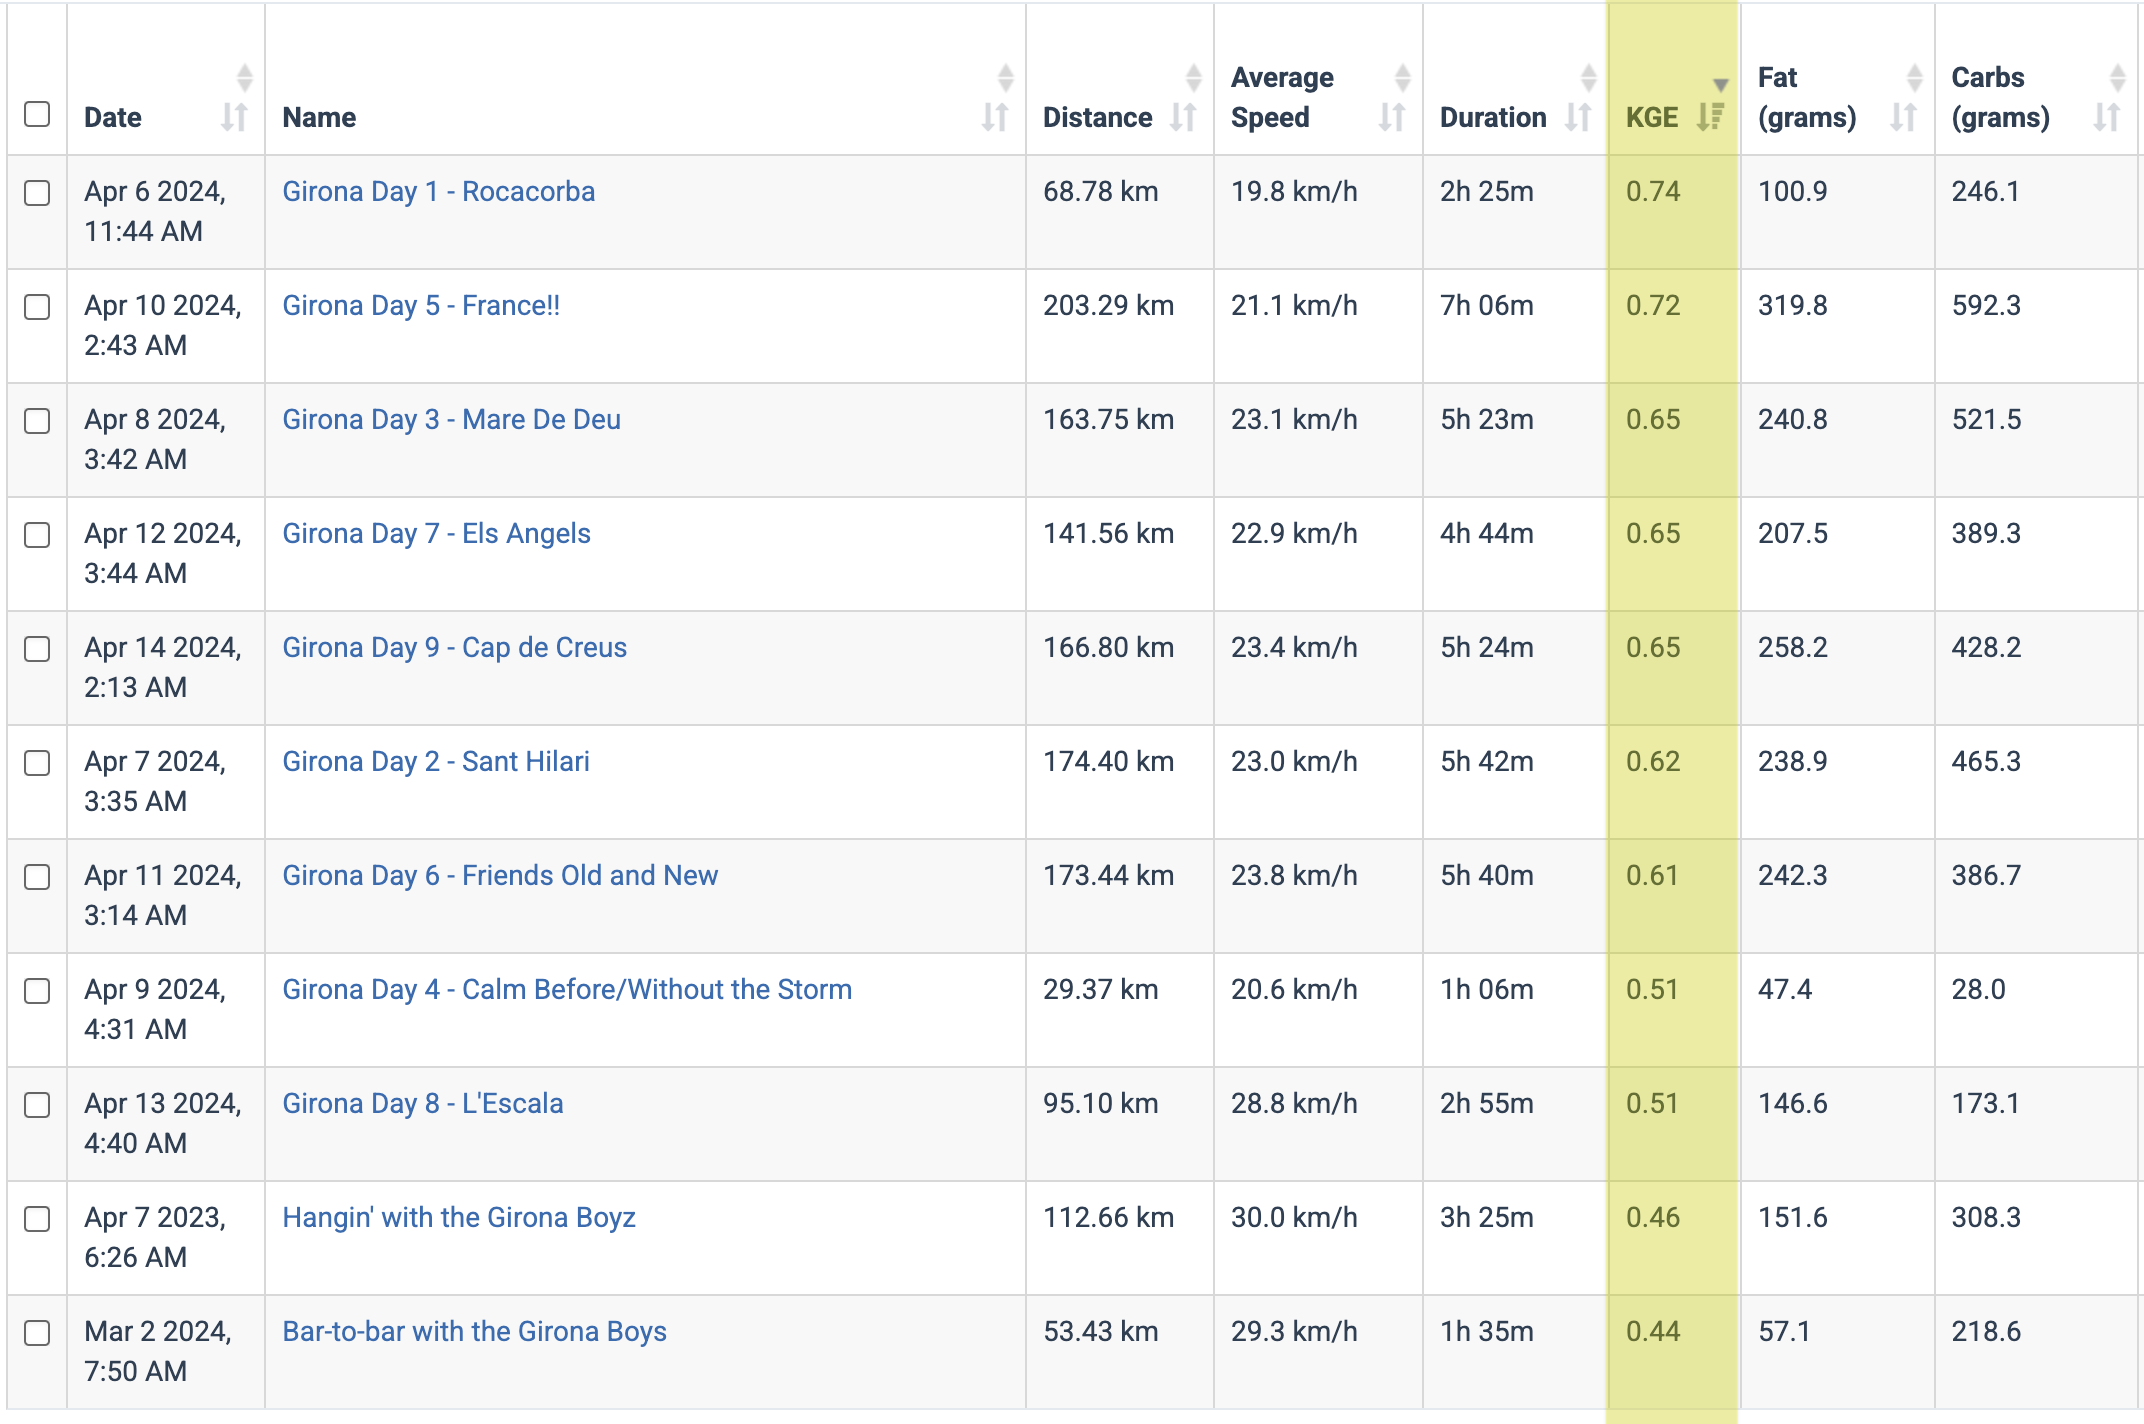
- Kilogram Exponent
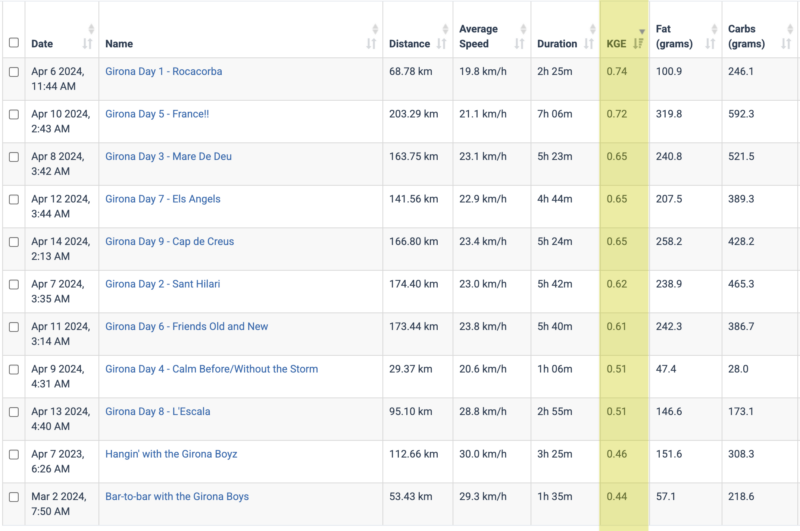
Kilogram Exponent (KGE) is the exponent used in the calculation of Relative Power. KGE is determined based on gradient of the terrain. In general, lower values indicate descending terrain whereas higher values indicate steeper grades.
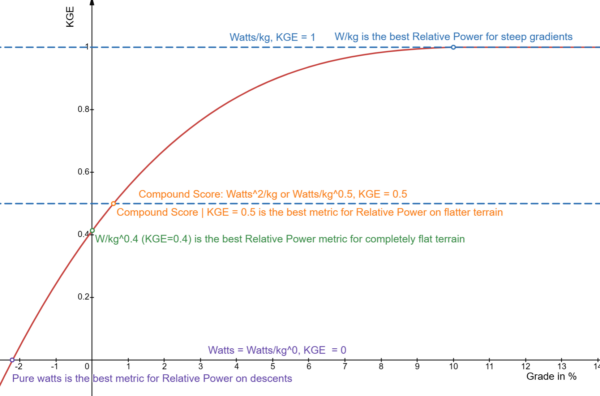
Note that when KGE = 1, the exponent essentially means the same as Watts/KG whereas when KGE = 0, the exponent essentially means the same as Watts. In other words, the steeper the gradient, the more the weight of the rider comes into play. The flatter the terrain, the less weight impacts performance.
KGE in Relative Power Calculations
To use KGE to calculate Relative Power, you simply use KGE as the exponent using the athlete weight as the denominator and 75 kg as the numerator. For example, for a 90kg rider on flat ground (KGE = 0.42) at 300W, at 75kg rider would have to output 300*(75/90)^(0.42) = 278W or 22W less.
How Average KGE is Calculated
To calculate the average KGE for a given activity, Xert calculates a weighted average KGE based on the gradient and your power. So if you are pedaling easy down a hill, for example, these gradients have less influence on the KGE compared to those times when you are pedaling hard on a steep climb.
Calculating the Effect of Terrain on Power for a Given Rider Weight
Interestingly, the effect of a reduction of 1kg of body weight, for a given KGE (based on the gradient) at a given power can be calculated quite simply:
Increase in Relative Power per kg = watts/kg * KGE
As an example, reducing weight by 5kg where KGE = 0.5 at 375W for a 75kg rider, is 5*375/75*0.5 = 12.5W.
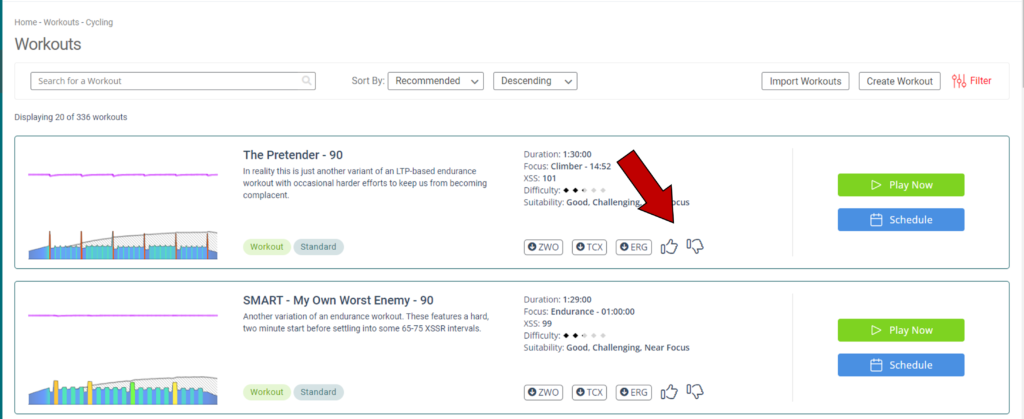
- Liking & Disliking Workouts
Do some workouts motivate you better than others? Are some workouts just not your thing or maybe you feel they don’t suit your needs as much as others?
Use the Like / Dislike feature to let the Adaptive Training Advisor know that you would like to have some workouts recommended with greater likelihood than normal (like or 👍) and other workouts you don’t care for (dislike or 👎). When the Adaptive Training Advisor evaluates all the workouts on the system, liked workouts receive a bit higher ranking and disliked workouts will be moved further down in ranking. This gives you greater control over the training you receive which keeps you more motivated and on-track with your improvements.
For example, you may not like doing sweet-spot workouts such as It Takes Two 82%. Click the disklike 👎 icon for that workout and it will move further down the rankings so that it’s not likely to get recommended.
With this new feature, not only are you able to refine the training recommendations via the Workout Filters, but you can also influence the recommended trainings based your own preferences. Liking a workout will increase it’s recommended score so it is more likely to be recommended in the future. Disliking a workout will decrease it’s score so you will be less likely to see the workout recommended in the future.
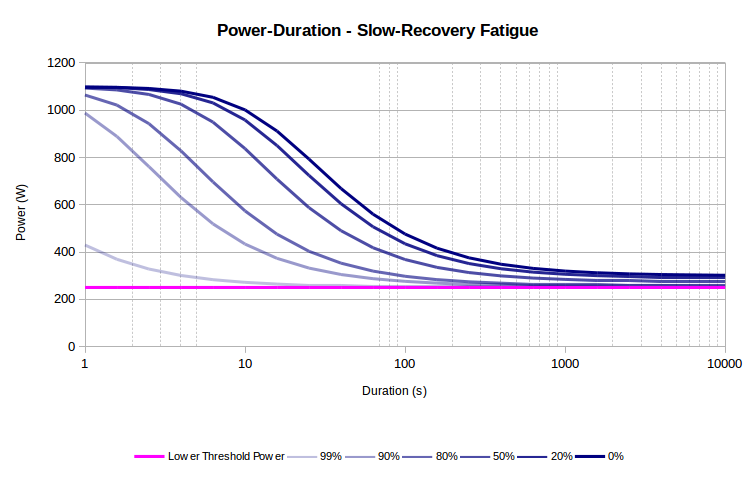
- Lower Threshold Power
Lower Threshold Power, also referred to as LTP, represents a modeling artifact associated with the depletion of Endurance Energy. As endurance energy declines over the course of a long activity, slow-recovery / long-term fatigue takes hold and Threshold Power, High Intensity Energy and Peak Power decline. The affect of long-term fatigue manifests in reduced MPA and MPA that declines more rapidly. LTP represents the lowest possible value for Threshold Power when all Endurance Energy reserves have been depleted:
- LTP
- Manual Signatures
Review and manage your entire fitness signature progression by assigning manual signatures to activities where you have a better understanding of your fitness and performance at that time.
To manage your current fitness signature, update your latest activity. Click the +Add button, select your latest activity and update/save the signature associated with it.
Note: Upon making changes here, Xert will carry out a trickle down process to update the signatures that follow the activity signature modified.
- Manual Training Loads
In situations where your training history is missing key information or you wish to set your training loads more accurately at a given point in time, use the Add feature to associate training loads at a given point in time to an activity. Once saved, Xert will do a trickledown calculation to all activites that follow and update your current training loads.
This is a good data hygiene practice throughout your historical data as it assists the system in more accurately calculating your Training Responsiveness. This in turn, improves predictions and helps identify what’s best for your training.
- Matchstick
“Burning matches” refers to the idea that in a long and demanding endurance races, an athlete has a finite number of high-intensity efforts or surges they can make before depleting their energy reserves and jeopardizing their overall performance. These high-intensity efforts are the “matches” that, once burned, cannot be easily replaced. Xert uses matchstick as an analogy to the different energy systems that cyclists rely on. Like the tip of a match, the phosphagen & anaerobic systems provide large energy over a short period of time – just like a powerful sprint. On the other hand, the long wooden matchstick is like the aerobic energy system that provides a long-lasting, but less-intense energy supply.
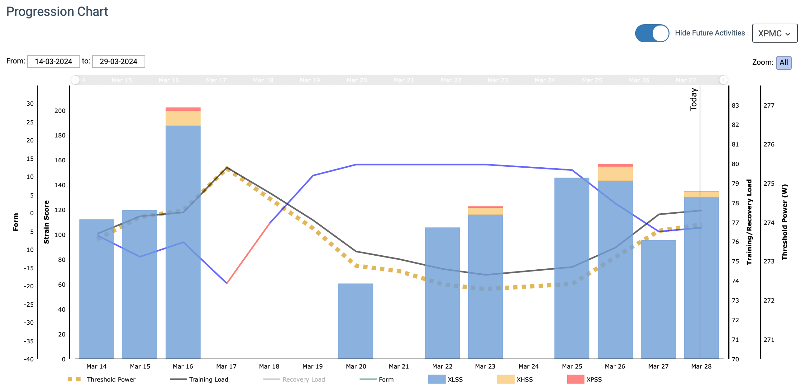
To make reviewing the XSS breakdown on your activities easier, the Xert Performance Management Chart (XPMC) will also display the XSS for each of your activities as a matchstick:
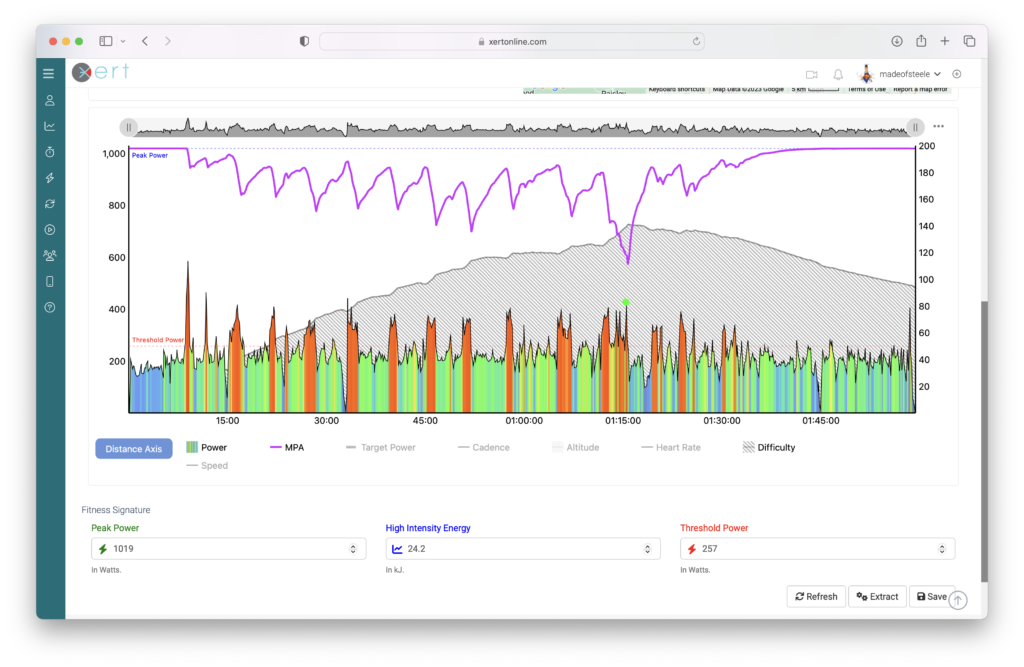
- Maximal Effort
Maximal effort, synonymous with point-of-failure, refers to moments during an activity where an athlete attempts to produce as much power as he/she has available. Maximal effort and point-of-failure are synonymous because both instances define the convergence of MPA and power. A maximal effort has the athlete attempting to sprint and generate as much power to reach MPA whereas a point-of-failure has the athlete attempting to hold on to power has MPA declines and reaches the desired power. In both cases, from the perspective of the data, MPA and power are equal.
It’s possible to have either one maximal effort, or several maximal efforts during one activity. Below is an example of one maximal effort:
And here’s an example of a Zwift crit race that has several maximal efforts:
- Maximal Effort Time
Maximal Effort Time is a duration, typically in seconds or sometimes minutes and seconds (mm:ss) that defines how much time during an activity, an athlete was close to MPA. Because fatigue hurts, reaching and spending time at your absolute limit (a maximal effort or point-of-failure) doesn’t occur with great frequency in data.
Maximal Effort Time uses an algorithm to determine how much time an athlete spent close to MPA. It is assumed that if an athlete doesn’t spend much time near MPA, then the activity doesn’t express the athlete’s fitness signature. That is, the activity is determined to be sub-maximal. The signature extraction process is therefore skipped and it is assumed that the athlete’s signature remains relatively unchanged from the previous activity’s signature.
However, when Maximal Effort Time is above a predefined level (current set at 5 seconds), it is presumed that those moments near MPA during the activity were expressive of the athlete’s fitness and a new fitness signature is extracted from the activity and recorded.
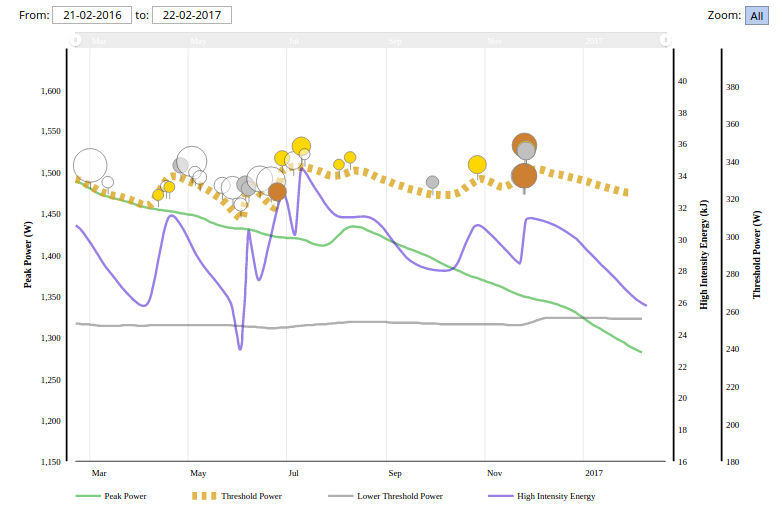
Maximal Effort Time is depicted in the size of the circles and medals shown on Progression Charts along the Threshold Power lines. Generally speaking, the greater the Maximal Effort Time, the greater the expression of the athlete’s fitness occurred in the activity:
- Maximal Power Available
Maximum Power Available, also referred to as MPA™, is a measure of the most power an athlete can generate at a given moment during exercise. By definition, the highest value for your MPA is equal to your Peak Power. Conversely, the lowest value for MPA is equal to your Threshold.
When riding hard (above your Threshold Power), your MPA decreases, indicating muscle fatigue. The higher about your Threshold Power (TP) you ride, the faster MPA declines. On the other hand, riding below TP allows MPA to increase/recover. The further below TP you recover, the faster MPA recovers.
The point where your power is equal to your MPA is defined as a point-of-failure or maximal effort. Maximal efforts are calculated by using power data together with an athlete’s Fitness Signature to calculate the athlete’s ability to generate power at any given point in time. These are visualized below where the MPA line (purple) dips down and touches your power data:
- Maximizing Your Training with Xert’s AI-Generated Workouts
Xert introduces AI-generated workouts! This feature lets you quickly create simple workouts tailored to the recommendations from the Xert Adaptive Training Advisor (XATA) or the new Xert Forecast AI (XFAI) training program. These workouts have a straightforward structure, making them ideal for both indoor training on a turbo trainer and outdoor rides on the road.
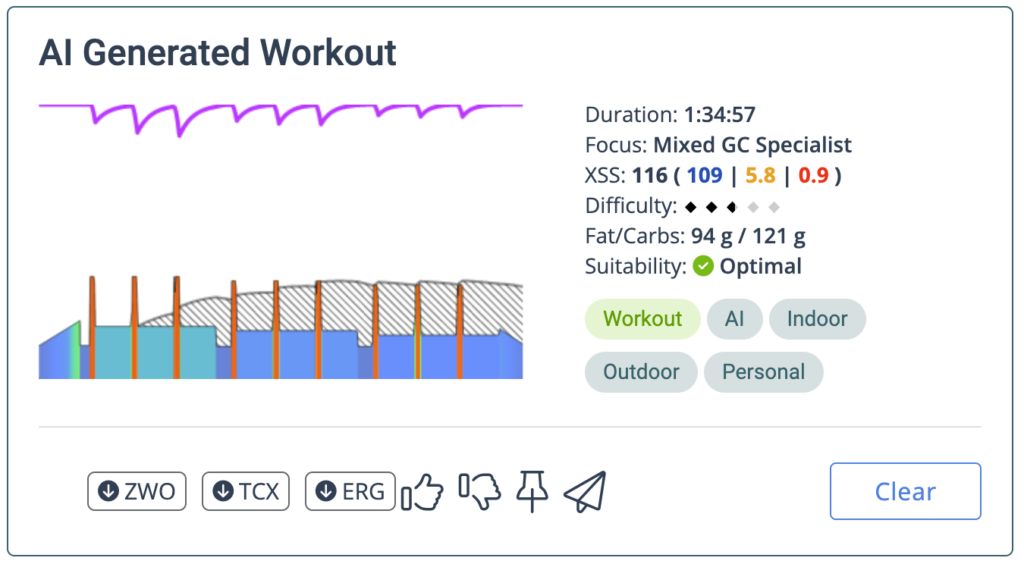 How It Works
The AI workout generator starts with a basic workout structure: 3 sets of 1-8 repetitions. Xert then fine-tunes the number of repetitions, work/rest intervals, and intensity to match the XSS demands of the day’s training. Throughout this process, Xert proactively adjusts to reduce workout difficulty when possible. One of the ways it does this is by gradually tapering the intensity of the intervals, meaning targets will slightly decrease as the workout progresses – similar to what’s already implemented in many of Xert’s SMART workouts.
For athletes using the Forecast AI Training Program, Xert generates workouts that strike the right balance of high and peak strain, challenging your body without leaving you overly fatigued for your next session*. As your high and peak training loads increase, Xert adjusts your training to ensure you can handle more intense workouts and higher levels of strain.
*By default, Xert uses a 4:1 polarization, meaning high-intensity workouts should leave you fatigued (indicated by yellow stars) for no more than four days. You can adjust the ‘Polarization Level‘ setting under Program Settings if you’d like to customize this balance.”
 Generating an AI Workout
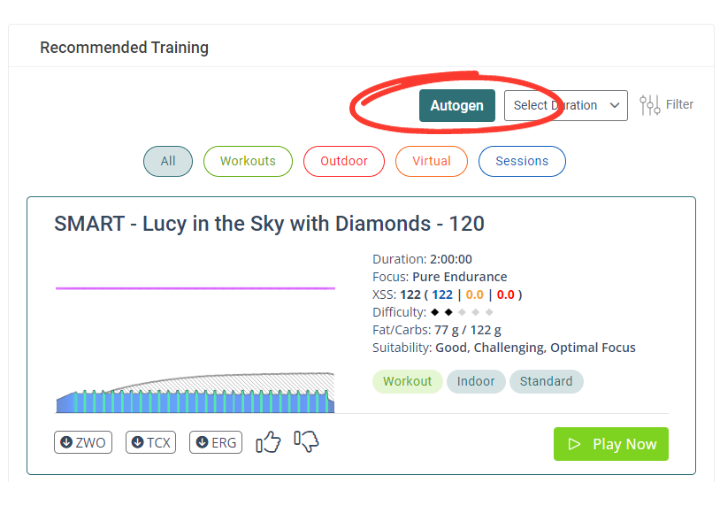
To generate a workout, simply click the ‘Autogen’ button on the right-hand side of the ‘Training’ tab. After a few seconds, the page will refresh with your auto-generated workout ready to go! When you open the Xert EBC app, the workout will appear automatically. If it doesn’t, try swiping down from the workout recommendations or closing and reopening the app.
If you’re using an XFAI plan, you can also generate a workout directly from the Fitness Planner. Just hover over the forecast placeholder and click the autogenerate icon (✨). Xert will generate the workout and schedule it for the appropriate day.
Exporting and Your Autogenerated Workout
You can easily export the AI-generated workout to other platforms like Zwift, Wahoo, Garmin, and more. Simply click the paper airplane icon and choose your preferred destination. Alternatively, you can download the workout file in ZWO, TCX, or ERG format.
Note: Garmin Connect has a 50-step limit for workouts, so any workouts with more than 50 steps cannot be synced to Garmin.
- Maximum Weekly Hours
 During the Training Plan set up phase, athletes can input the number of hours that they wish to apply weekly towards their training. In general, higher maximum weekly hours enable athletes to achieve higher levels of fitness. However, in the case where an athlete is undertrained, they made not be able to reach their maximum weekly hours initially. They may still need to build their training loads in order to permit them to apply the maximum weekly hours towards training.
For example, an athlete may only be training 4 hours a week but may decide they wish to invest 14 hours a week into training. Initially, Xert will not allocate all 14 hours since this would likely be too much training for the athlete. The principle of progressive overload with recovery will limit the number of hours the athlete can train but this number will increase over time. Eventually, given enough time, the athlete will reach a level of fitness that will allow them to train 14 hours a week. This volume is then maintained until they reach their goal or, if 14 hours isn’t sufficient, they’ll receive an warning that the target cannot be achieved. Some training goals/events may require more hours than 14 and thus many not be achievable without committing the extra time needed to your training.
Feel free to experiment and do “what-if” scenarios to get a sense of what’s limiting your ability to improve sufficiently to reach your goals. Sometimes, you don’t have enough time to train before the event date. Sometimes, you don’t have enough weekly hours available to reach our target training level. Either way, you may need to reduce your Event Readiness which can allow you to complete the event but not at the level that will be optimal for performance. Ideally, given enough time and and choosing goals that are within reach, you’ll be able to execute a training plan than helps you reach your goal within the time you have available to train.
- Mean Maximal Power
Mean Maximal Power, also referred to as MMP, represents that highest average power for a given period. It is used in Xert’s Workout Designer to represent the highest power that is sustainable for a given duration. For example, 20 min MMP represents the highest average power that can be sustained for 20 minutes.
MMP is also used interactively in Xert EBC to represent the highest power that could be sustained for a duration at a given moment. For example, after riding for 12 minutes at an athlete’s 20 min MMP which is, say, 250 W, at that moment, the athlete’ 8 minute MMP would also be 250 watts.
Side note: Although the term MMP is used in Xert, it would be more correctly described as maximal sustainable power, since Xert establishes your power duration relationship based on fresh-to-failure, steady-state efforts and not on average power. Using MMP calculations from regular power data is more commonly used to establish the power-duration relationship, despite its limitations. The term MMP has been chosen because the concept is more readily understandable.
- MMP
See Mean Maximal Power.
- MPA
MPA stands for Maximum Power Available. It is a measure of the maximum power an athlete can generate at a given moment during exercise. As an athlete fatigues, MPA declines. And as they recover, it increases. For more information, see Maximal Power Available.
- Multisport Profiles
The Multisport Profiles feature allows users to track their running and cycling fitness signatures, breakthroughs, & XPMC’s, as well as seamlessly switch between the two activities from within the same account. Here we will look at how to add, switch, or remove secondary profiles in your Xert account.
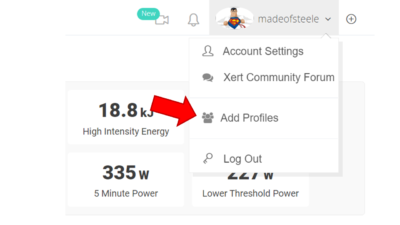
Adding a New Profile
To get started, navigate to the top right-hand corner of the Xert website and hover over your username. From the dropdown menu, select the ‘Add Profiles’ option. Select the Profile that you’d like to set up: either Cycling, Running, or Other:
Most users will want to add a secondary profile for running, if they’re primarily a cyclist. After adding a new profile, you can selectively sync activities to that profile from either Garmin or Strava by navigating to Sync > Garmin Connect or Sync > Strava. By default, a cycling profile will only sync cycling activities and a running profile will only sync running activities. The ‘Other’ profile can be used to sync any other activities (swimming, weight training, etc.).
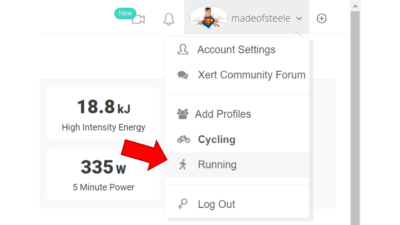
Switching Profiles
To switch from Cycling to a running profile, hover over your username in the top right-hand corner. The currently selected profile will be displayed in bold. To switch profiles, select the profile that you’d like to switch to:
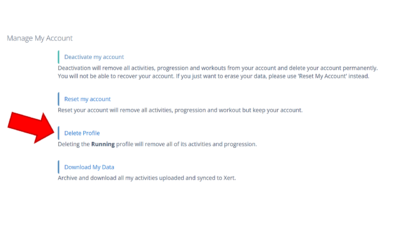
Removing Profiles
To remove a profile, head to Account Settings > Personal Info and scroll down to the ‘Manage My Account’ section. Find the alternate profile that you wish to remove (Running, Cycling, or Other) and select the Delete Profile option. All activities and your XPMC for that profile will be removed from your account without affecting your primary profile data. You will receive a confirmation notice at the top of the web page once the profile has been deleted.
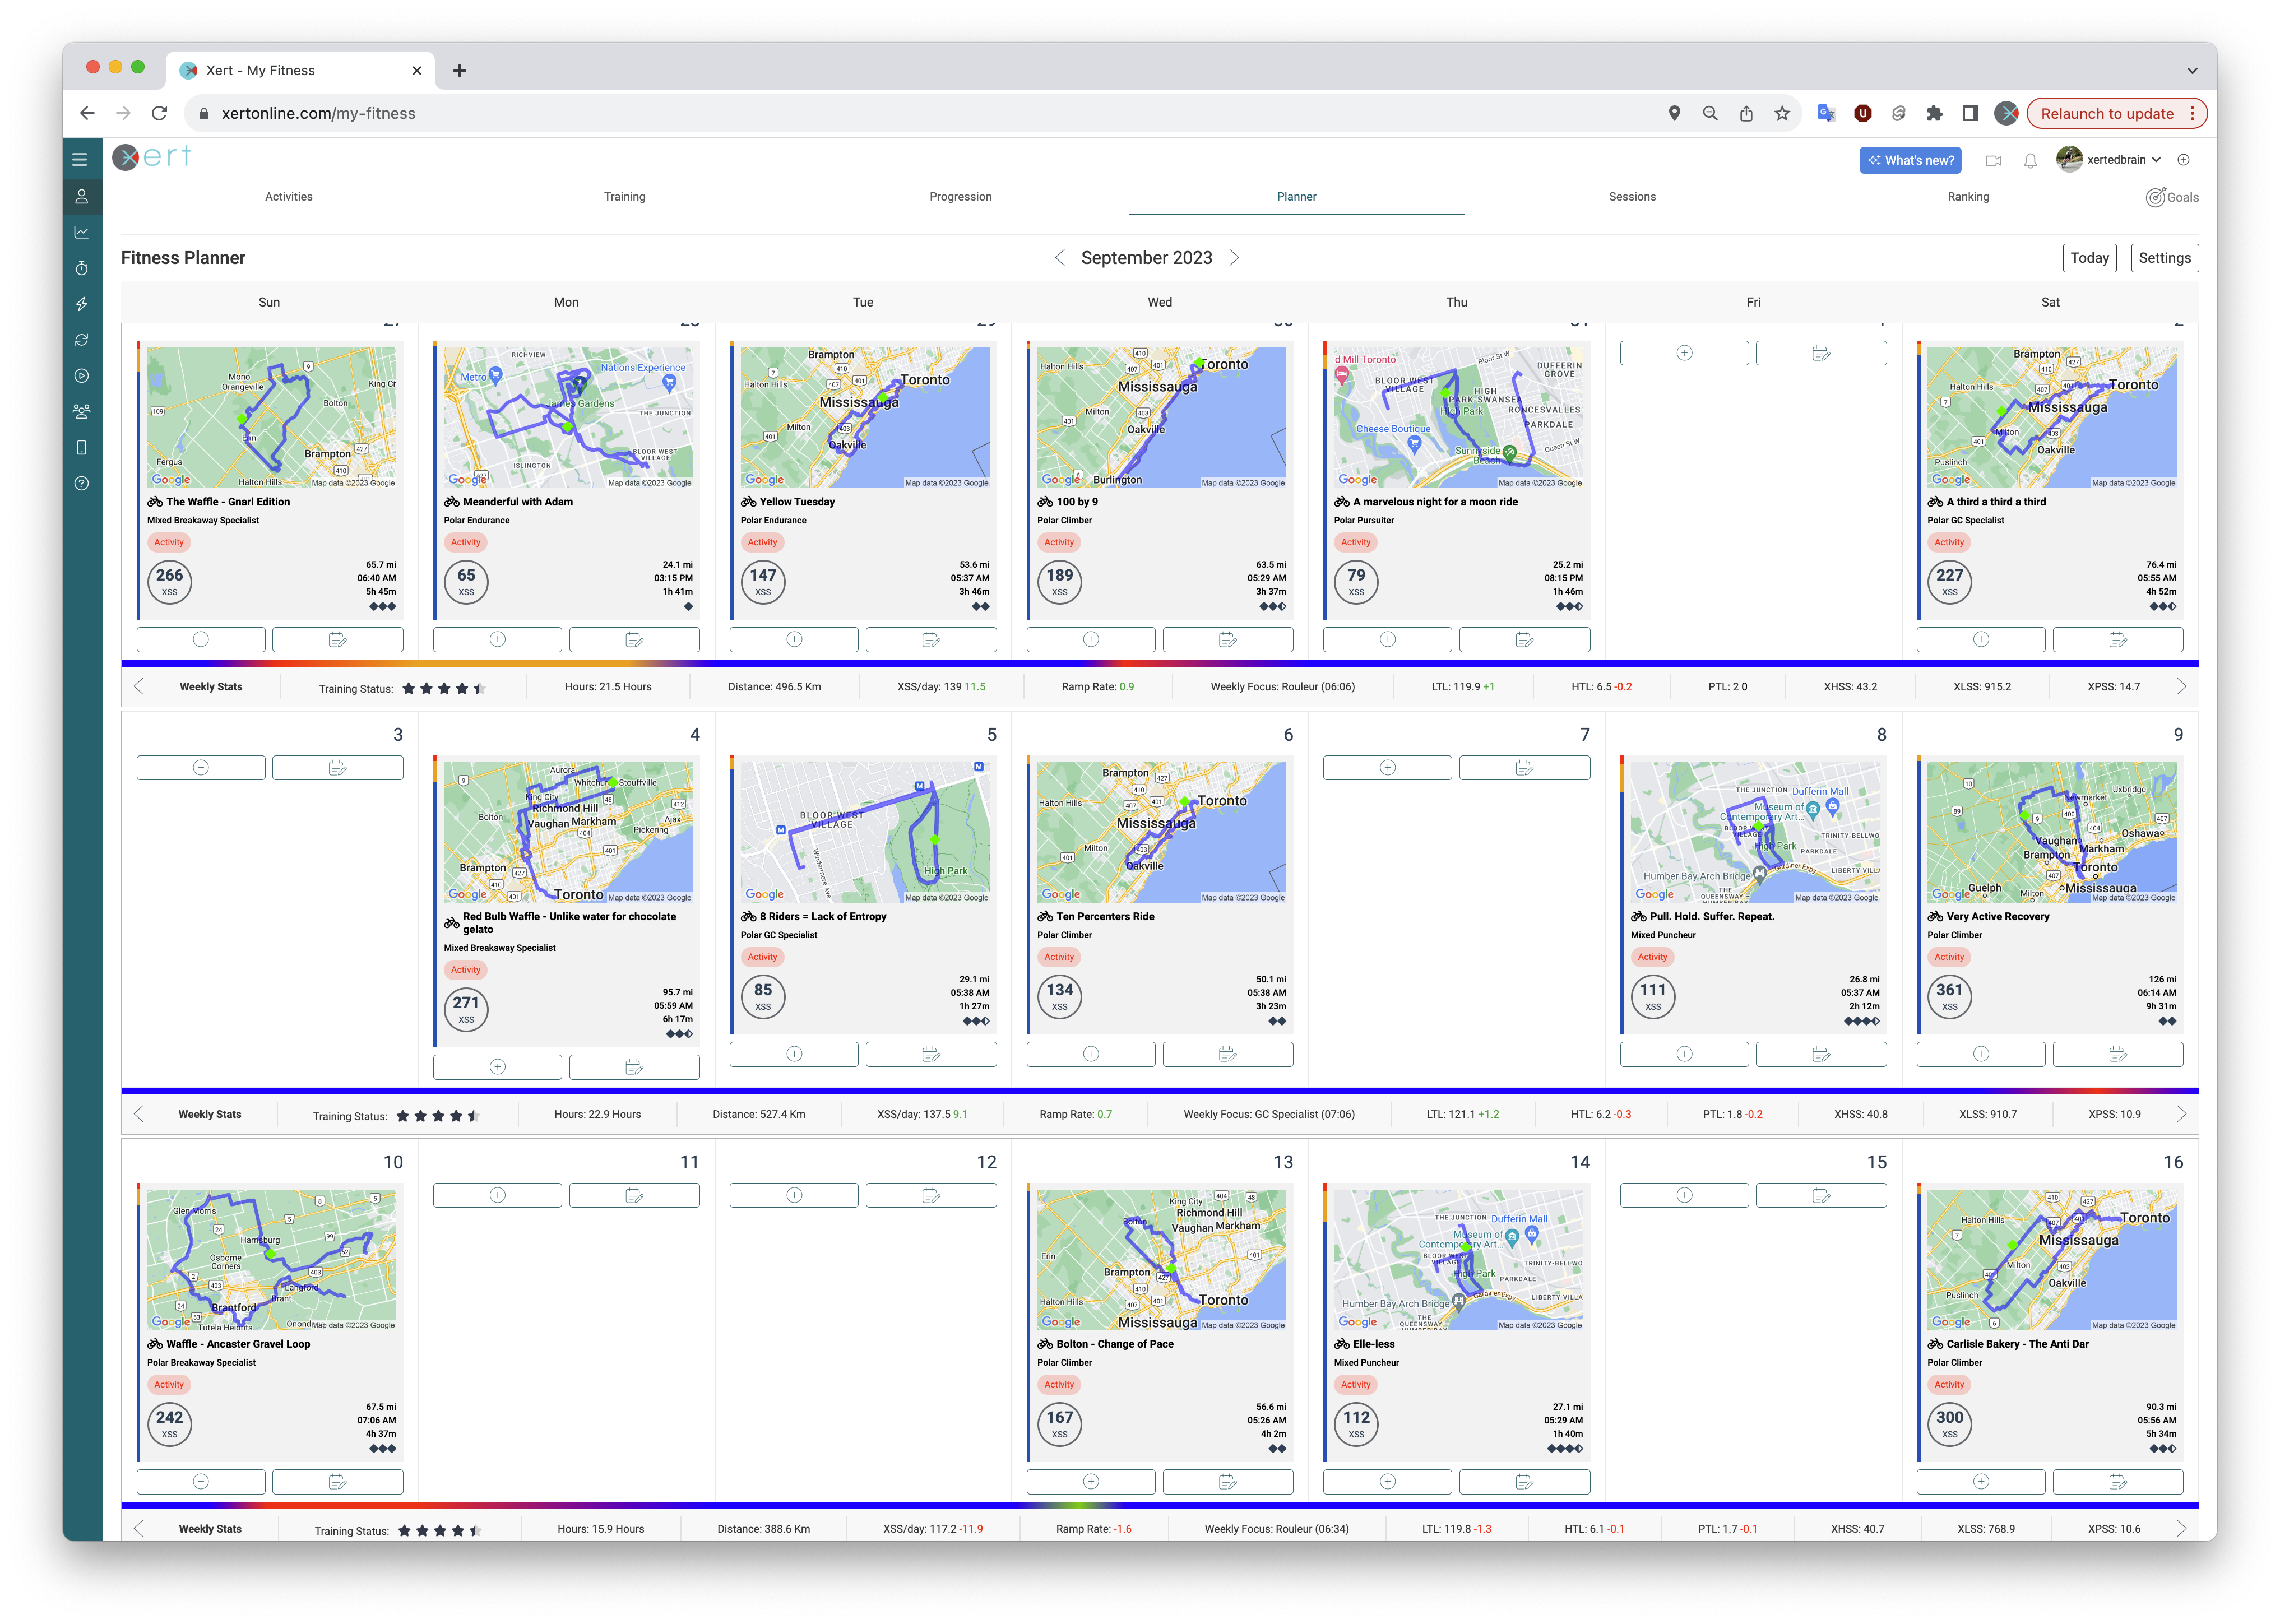
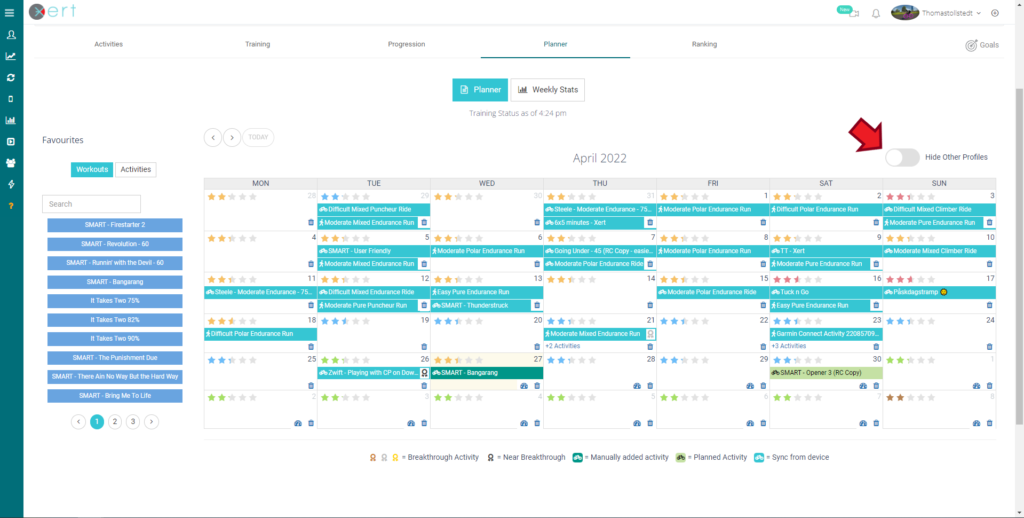
Multi-Profile Fitness Planner
In addition to being able to quickly and easily filter your running and cycling activities, you’ll be able to view activities from multiple profiles on your fitness planner. In the top right-hand corner of the fitness planner, you’ll have an option to hide or display activities from other account profiles:
- Peak Power

Peak Power, often abbreviated as PP, is an athlete’s highest possible power. It is also one of the three parameters that define an athlete’s Fitness Signature. Sometimes it is referred to as Pmax. MPA is equal to Peak Power when an athlete is not fatigued.
NOTE: Mathematically, Xert’s calculation of the power-duration relationship is identical to P = CP + W’/t when Peak Power is infinite.
- Periodization Level
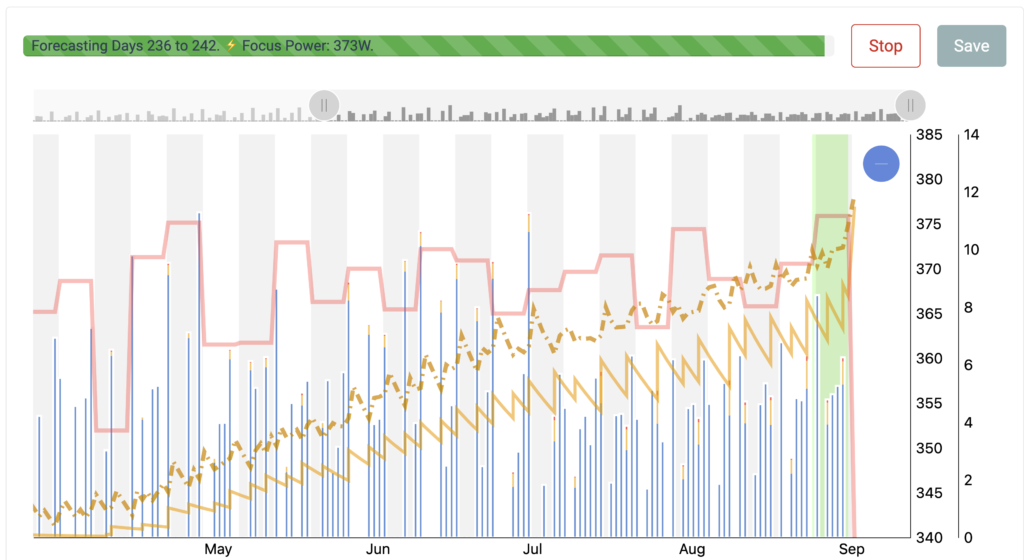
Figure A – Increasing High Intensity Training as the Training Plan progresses.
Periodization of training is the intentional change in training prescription over the course of a training plan in order to reduce the overall training volume, improve results and avoid over training. In Xert, training is periodized and structured in order to help athletes achieve their goals whilst minimizing the training volume involved. This change in focus during a training plan enables the athlete to target the systems that are most responsive to training when this training is most effective.
For example, a 200-day training plan that is not periodized would have you training the same way throughout the plan whereas when it’s periodized you may start with base training initially and add in more high-intensity training the closer you get to the event date. This change from base to build is a periodization example that is applied in order to maximize the benefit of the high-intensity training since it has greater effect closer to the event date. High intensity training has less benefit relative to low intensity training, the further away from the event date.
Xert users can control the effect of periodization using this slider. In the vast majority of cases, you’ll want to leave it at the default setting of 2.5%. You may want to reduce the setting if you prefer to progressively train all systems at all times and would rather not see periodization. Some coaches and training methods advocate and promote high intensity training throughout a training plan and reducing this value in Xert by sliding it left allows you to include more high intensity training.
You can experiment and do “what-if” scenarios with your training plan by sliding this left or right and clicking the Forecast AI button to see what the system will generate with less/more periodization applied. You’ll notice a greater effect, the longer the plan. For example, any plan that’s periodized and longer than 100 days or so, will have you doing base training at the beginning of the plan exclusively. Xert calculates the periodization as part of the plan and it’s based on the level you choose and the time constants used in the underlying Banister impulse-response model applied to each system – low, high and peak.
- Polarity Ratio
See Intensity Ratio
- Polarization Level
Training polarization, or polarized training, is a methodology commonly used in endurance sports such as cycling, running, swimming, and rowing. This approach emphasizes a clear distinction between low-intensity and high-intensity training sessions, while minimizing time spent in the moderate intensity zone. The aim is to optimize performance gains, enhance fitness, and reduce the risk of overtraining and burnout.
The idea behind polarized training is that high-intensity efforts provide a strong stimulus for physiological adaptations, such as improved aerobic and anaerobic capacities. Meanwhile, low-intensity sessions support recovery and endurance. By focusing on these distinct intensity zones, athletes avoid the “gray area” of moderate intensity, which can lead to fatigue and overtraining without delivering maximal benefits.
While polarized training is effective, it’s not the only approach. Other methodologies like threshold training, tempo training, and long slow distance training also have their place, depending on an athlete’s goals, sport, and training phase.
Adjusting Your Training Polarization
You can adjust your Polarization Level from the Profile Settings page under the ‘General‘ tab. Simply drag the slider left or right to decrease or increase your target training polarization. The range goes from 1:1 (e.g., high-intensity workouts every other day) to 5:1 (e.g., high-intensity workouts once every six days).
- Higher polarization (4:1 or 5:1) results in harder workouts on a less frequent basis.
- Decreasing polarization (1:1 or 2:1) leads to easier workouts, but more frequently.
- Power Curve
Synonymous with Power-Duration Chart and Power-Duration Curve (PDC), this describes the relationship between how long an athlete can sustain a given power with a few assumptions:
- Starting from fresh
- Riding at a steady-state, and
- Ending with the inability to sustain the given power.
Note: Inability to sustain the given power is called a point-of-failure.
In Xert, your power-duration relationship is determined by applying a special use-case of MPA. The duration that an athlete can sustain a given fixed work rate (i.e. state-state power) is determined by calculating how long will it take MPA to reduce from Peak Power until steady-state power equals MPA. This calculation can be performed at any given intensity to determine duration or using a given duration to determine the steady-state power. Note that since the athlete’s Fitness Signature is used to formulate MPA, your Fitness Signature can be depicted as a power-duration curve for visualization and to help interpret fitness.
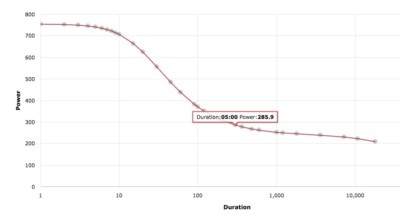
An alternative approach to defining the power curve is to use Mean Maximal Power (MMP) data. Using MMP generally results in similar values to steady-state, fresh-to-failure efforts as described above but can have more variance. A power curve defined using MMP data, obtains the highest average power over a given duration from an athlete’s power data. There is a presumption that the efforts are started from fresh, didn’t have periods of rest or partial rest and ended with the athlete’s inability to sustain the average power over the period. One must acknowledge that the occurrence of such data – where the athlete starts from fresh, doesn’t have any moments where power drops below Threshold Power and where the athlete’s inability to sustain the average power did not precede nor could have succeeded the end of the period – is rare in regular power data.
Below are two power curves, the red curve is derived from MMP data whereas the purple curve is derived by determining the Fitness Signature that expressed the MPA for the activity. Only when the red and purple coincide, was the corresponding MMP effort started from fresh, didn’t have moments below TP and ended in a point-of-failure. In this sample activity, no MMP efforts exhibited this.
- Power Curves – Activity
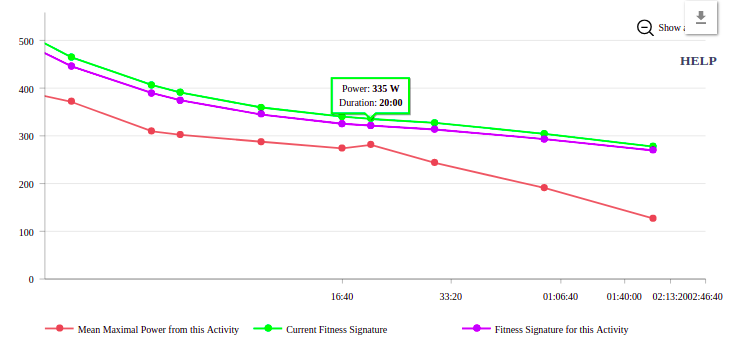
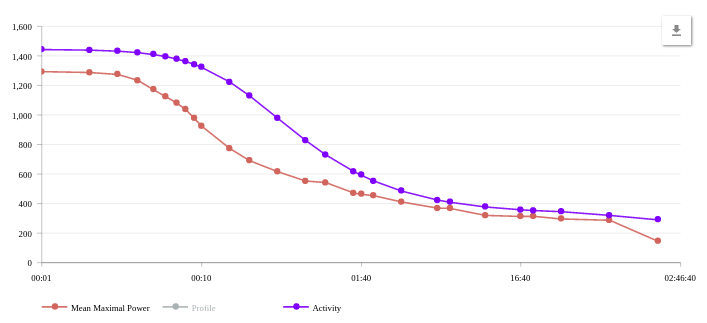
When reviewing an activity’s data using the Activity Details page, the Power Curve tab reveals the following chart:
The chart shows 3 lines:
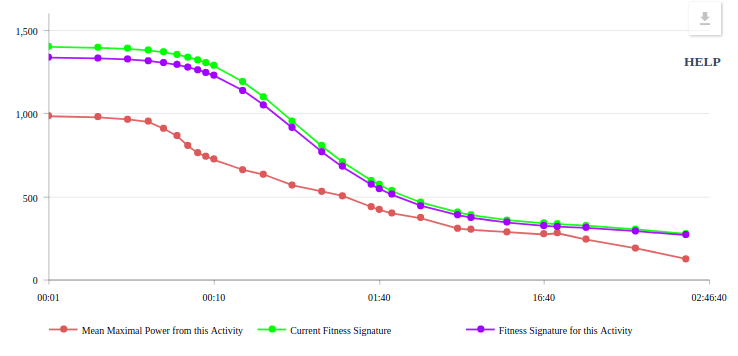
Colour Power Curve Description Red Mean Maximal Power from this Activity The mean maximal power (MMP) power curve is the traditional way in which activities are evaluated. Here we chart the MMP data for the current activity. MMP is calculated by looking for the highest (i.e. maximal) average (i.e. mean) power in the given activity for the indicated duration. For example in this activity, the highest average 20 minute power (or 20 minute MMP) is 281W. Xert’s MMP algorithm combs through the activity to determine this highest value. In the vast majority of cases, MMP values do NOT represent your highest possible value over the given duration. See the glossary entry on Power Curves for an in depth explanation. Violet Fitness Signature for this Activity The Activity’s Fitness Signature can be use to plot a power curve that would represent the highest possible power over the given set of durations you would technically have been capable on this date. The curve is calculated from your fitness signature and represents a theoretical power curve. It is theoretical because it is impossible to measure your maximal possible power at every duration at a given point in time. Xert use your Fitness Signature to provide an estimate as to what your best would have been had you performed a perfectly paced effort from an unfatigued state on the given day. Xert establishes your Fitness Signature using extraction and your MPA data, where fitness breakthroughs provide feedback in determining your fitness signature. Green Current Fitness Signature For convenience, Xert also plots the power curve that is based on your current fitness signature, i.e. what is your power curve as of now. If the activity occurred a few months ago or even a few weeks ago, you may notice a difference between what your fitness was then and what it is now. If the activity was your latest activity, you will likely see both Violet and Green lines overlap which means they are the same. (Slight variations can occur due to Signature Decay and adjustments from Training Loads). Using click-and-drag (or tap-tap-and-drag using your finger on mobile devices and tablets), you can zoom into a section of the chart to get a closer look on various regions of your power curve. For example, here we have zoomed in to the 20 minute range in order to compare our 20 minute efforts:

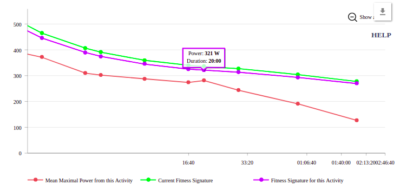
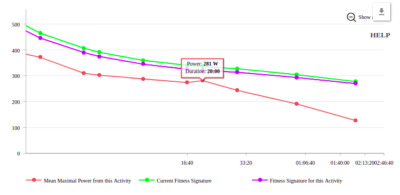
Here we can see and compare our 20 minute power:
Colour 20 Minute Power Description Red 281W During this activity, the best 20 minute effort that was acheived averaged 281W. Indeed, the effort may have been maximal where you could no longer sustain your 20 minute power but because the effort may have started in a slightly fatigued state or the effort had periods where it wasn’t properly paced, the value 281W isn’t representative of your absolute best. Had you started in an unfatigued state, paced the effort smoothly, and at precisely the 20 minute mark you could no longer sustain your 20 minute power, the average power would have been your best and it would have been higher. Violet 321W Had you attempted a 20 minute effort on this day, and had started it in a unfatigued state, paced it perfectly and at precisely the 20 minute mark you could no longer sustain the power, Xert would have predicted 321W would be what would have been you absolute best. (Interesting aside: If you had used the Segment Hunter for an segment that had a duration of 20 minutes, it would have paced you at 321W). Green 335W As of the current time (today), if you attempted a 20 minute effort, Xert would expect you to be able to sustain 335W. - Power Duration
See Power Curve.
- PP
See Peak Power.
- Program Phases
Training Programs are currently set at 120 days and count backwards from your Target Event Date. The first 45-days of your program is your Base Phase which incorporates mostly Endurance-focused training. The second 45-days is your Build Phase which starts to introduce greater intensity into your training. The final phase is your Peak Phase which lasts 30 days and targets your power for the Athlete Type you have selected.
Here is an example training program for a Puncheur. In the base phase, training is focused on Endurance. In the peak phase, it is focused on Puncheur. In between, the change is periodized.
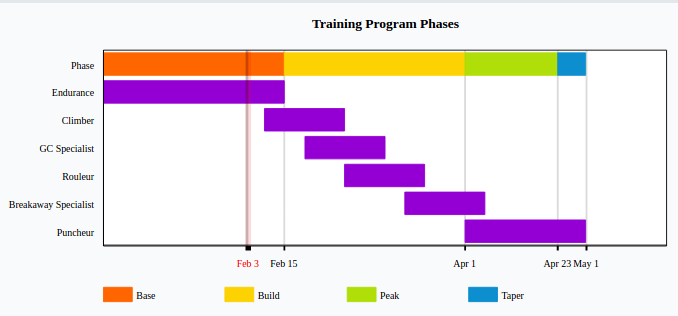
If your Training Program has not yet started, you are in the Pre Base phase of your program. If your Target Event Date is in the past, you’re in the Post Event phase of your program. In both cases, there is no specific guidance used for the Focus of your training; the advisor simply offers a wider variety of workouts that are near your Athlete Type.
- Program Type

Forecast AI Programs
Goal Use a power goal as your target. You can choose from a particular duration based on Athlete Type that you would like to improve and by how much. Forecast AI will generate a plan for you to be able to achieve this power. Event Pick from a list of available events. Forecast AI will first assess how high your training loads will need to be for this event based on the total strain demands – Low, High and Peak XSS for the event. Forecast AI will generate a plan for you to able to reach these training loads by the event date and will also provid a taper in the final week so that you are sufficiently ready for the event. Race Race AI is enables you to assess what is required to achieve a particular result that comes from a ride file. Adaptive Training Advisor Programs
Base-Build-Peak This is a generalized 120-day program with a Base phase of 45 days, Build phase of 45 days and a Peak phase of 30 days. Continuous Continuous Program is the default program offered by the Adaptive Training Advisor. Your goals and training are on a continuous improvement path and can be reviewed on a rolling 6 week training window. Challenge Select this for a 30-day Program that encourage you to reach new levels within a 30 day period. - Race AI Carb Rate
You can aim to reduce the estimated carbs per hour you will burn during the race. This setting is particularly useful for longer events where self pacing to limit the fuelling demands will be needed for success at the race. Lowering this value, increases the fitness you will need to reach. Increasing this value, reduces the fitness you will need but will increase the fuelling demands and intensity you plan to race at.
See the Race AI Guide
- Race AI Difficulty
You can aim to limit the amount of Difficulty you will experience in trying to perform this race. Generally, Difficulty Scores over 150 are rare and will be challenging to complete. Races that involve and lot of hard, repeated efforts will increase the Difficulty Score. Increasing this number will require less fitness for you to reach and improve a race’s fitness achievability . Howerver, it will be harder to do on race day.
See the Race AI Guide
- Ramp Rate
Ramp Rate is the numeric form of Improvement Rate. It is the rate at which your overall Training Load is increasing. It ranges from -2 (the “Off-Season” Improvement Rate) to +7 (“Extreme 2” Improvement Rate).
- Recommended XSS for Xert Adaptive Training Advisor (XATA)
As part of your training program with Xert, the Adaptive Training Advisor (XATA) calculates your daily XSS surplus/deficit based on your current Training Load, Improvement Rate, recent training, and available training time. From there, Xert recommends training for you based on your XSS (split into Low, High, & Peak), Focus, Difficulty, and more.
> How does Xert calculate the Recommended XSS?
Xert’s XATA uses the following factors to recommend daily XSS:
- Improvement Rate: The higher your improvement rate, the more XSS you’ll need to do each day to stay on track
- Training Availability: Xert estimates how much XSS you can achieve in the time you have available for training, which is based on your XSS per hour preference & available training time.
- Note: By default, Xert automatically calculates your available training time as the median training time from the last ~6 weeks, but you can adjust this manually in your Fitness Planner or under your General Profile Settings.
Even if your XSS deficit is much higher than your available time, Xert will only recommend XSS that can realistically be achieved within that time, ensuring you don’t overreach your daily goals.
> Why do I see multiple recommended XSS values from the Adaptive Training Advisor?
The ATA now recommends Low, High, and Peak XSS targets individually for your day, which provides a more streamlined and consistent approach to your daily targets. On the right-hand side of your training page, you’ll see workouts, indoor and outdoor rides, that most closely align with your recommended Low, High, and Peak values. You can also Autogen a workout that achieves the desired Low, High, & Peak targets.
In this example, the athlete has a deficit of nearly 300 XSS, but only 1.5 hrs of available training time. Therefore, the ATA is recommending 121 XSS, which is broken into 112 Low, 6.8 High, & 2.0 Peak:
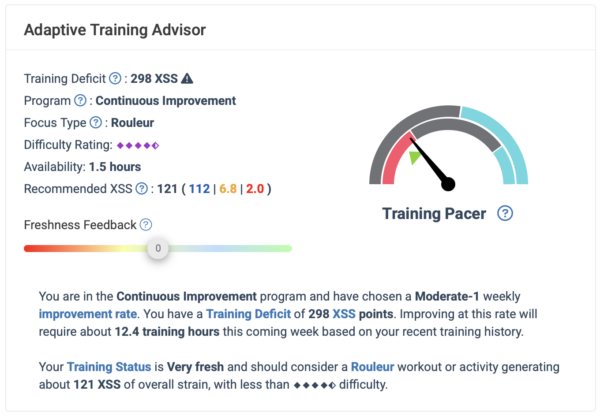
> How can I filter my training recommendations by a specific activity type?
By default, Xert will show all activity types in the activity recommendations panel on the right-hand side. If you prefer to view recommendations for a specific activity type, you can simply click on the relevant activity bubble (e.g., “Virtual” or “Outdoor”) to filter the results. You can also use the duration filter or the full filter for more control over your recommendations.
In the image below, the athlete has filtered their recommended training by selecting the ‘Virtual’ button to only display recommended Virtual Rides:
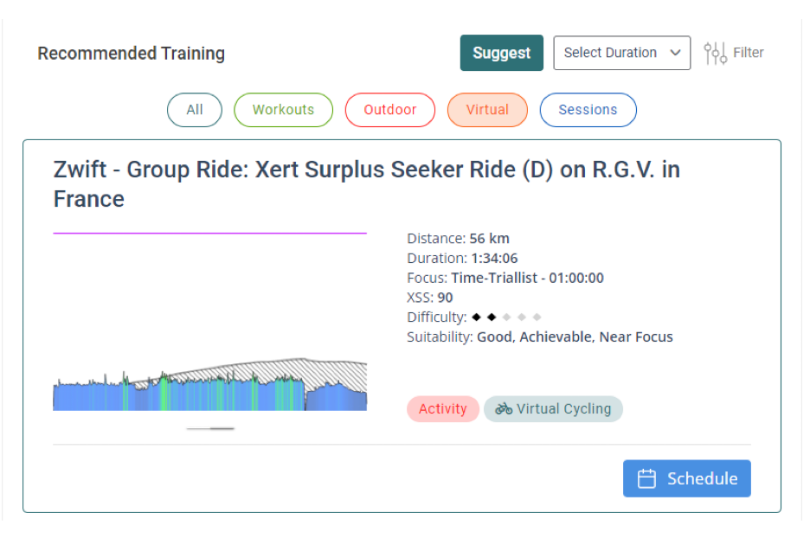
- Recovery Demands
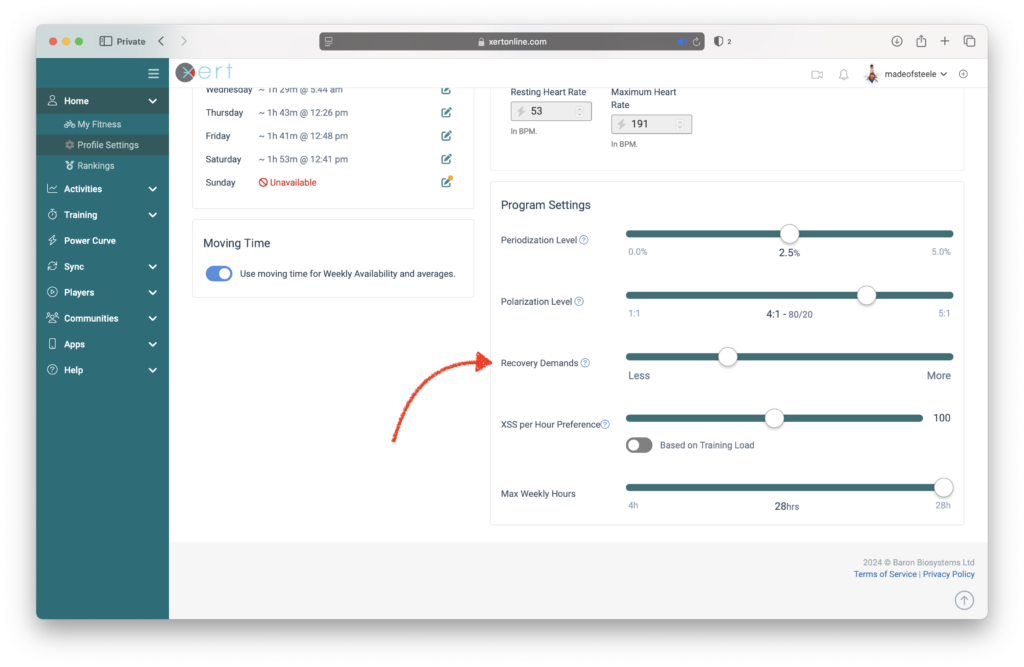
By default, Xert will calculate your recovery needs from your uploaded activities. These show up as Form on the Planner and the Adaptive Training Advisor uses this to prescribe the training. You’ll notice the effect of this with red and yellow gradient colours for example. This is where your setting for Recovery Needs is used – less recovery will mean shorter red and yellow sections and more recovery means longer red and yellow sections:

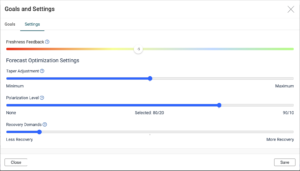
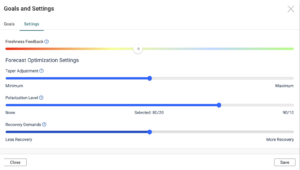
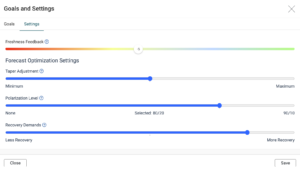
You will find the Recovery Demands Slider in the Profile Settings page under the General tab. Move the slider to the right if you wish to be a bit more conservative, or if you feel that you need additional recovery days. Move the slider to the left if you feel that you are able to recover more quickly or if you want to have less recovery/rest days. Recovering more quickly means you can train more and increase your fitness more quickly. You can choose a higher improvement rate. Recovering more slowly reduces your ability to ramp up your training and you may need to choose a lower improvement rate.
Note: caution should be used when reducing this setting – this could potentially lead to overtraining and/or burnout.
There can be differences in how people recover from cycling based on a variety of factors including individual fitness levels, genetics, age, nutrition, hydration, sleep, and overall health. Recovery is a complex process that involves physiological, biochemical, and psychological factors. By default, Xert considers several of these factors when calculating your recovery needs:
- Fitness Levels: Individuals with higher fitness levels might recover more quickly from low-intensity cycling compared to those who are less fit. Well-trained athletes often have more efficient cardiovascular systems, which can help with quicker recovery.
- Training Load: The intensity and duration of the cycling session can impact recovery. Even though low-intensity cycling is less taxing than high-intensity workouts, individuals who are new to exercise might still need more time to recover.
- Previous Conditioning: People who are regularly engaged in low-intensity cycling or other forms of exercise might adapt over time, leading to faster recovery as their bodies become accustomed to the activity.
However, there are some factors that Xert isn’t currently able to consider that might impact your recovery. Some of the factors listed below may impact whether you wish to personalize your recovery setting:
- Age: Age can play a role in recovery. Younger individuals tend to recover faster due to their generally higher metabolic rates and greater resilience of tissues. Older individuals might experience slightly slower recovery due to factors like reduced muscle mass and slower metabolism.
- Individual Response: Every individual’s body responds differently to exercise. Some people might experience muscle soreness or fatigue more intensely and take longer to recover.
- Genetics: Genetic factors can influence an individual’s response to exercise and recovery. Some people might naturally have better muscle recovery mechanisms than others.
- Illness: Whether you are a competitive athlete recovering from an acute illness or a fitness enthusiast suffering from a chronic disease, your ability to recover from additional stress due to exercise may be affected.
Lastly, there are some additional factors that might factor into your recovery from exercise in general. These factors are transient and could be accounted for using the Freshness Feedback Slider.
- Nutrition: Proper nutrition is crucial for recovery. Consuming an appropriate balance of carbohydrates, proteins, and fats post-exercise can support muscle repair and replenishment of energy stores. Adequate hydration is also important.
- Sleep: Sleep is a critical factor in recovery. During sleep, the body undergoes repair processes that are essential for muscle recovery and overall well-being. Individuals who get sufficient and quality sleep often recover faster.
- Hydration: Staying hydrated before, during, and after exercise is important for maintaining performance and supporting recovery. Dehydration can slow down recovery processes.
It’s important to note that recovery is not a one-size-fits-all concept. Factors like individual goals, overall health, and training programs also come into play. Listening to your body, providing it with the necessary resources (nutrition, sleep, hydration), and gradually increasing exercise intensity can all contribute to better recovery.
- Recovery Load
Recovery Load, abbreviated as RL, this is part of the XPMC and represents the exponentially-weighted moving average of activity XSS values based on the Recovery Load Time Constant. It can be subdivided into Peak, High and Low Recovery Load. It is analogous to Acute Training Load in Banister’s Impulse Response Model.
Recovery load quantifies how much recovery you need based upon the recent training you’ve been doing. It rises when activities are performed based on the XSS you accumulate and slowly declines over time. In Xert, the more training you do, the less of an impact Recovery Load has on you. Imagine when you first started training, how much recovery you would need after doing a hour ride. When you train, you need less time to recover from these same rides.
In Xert, you don’t need to keep track of Recovery Load directly. The software will summarize how much recovery you need and simplify this by using Training Status and Form.
- RL
See Recovery Load.
- Signature Decay Method
The Signature Decay Method (found under Account Settings / Profile) identifies the algorithm that will be used to model how your fitness signature values move both up and down as you train. For example, if you do 12 weeks of constantly increasing training, the Fitness Signature you have now will not be the same as what it was 12 weeks ago. One or more of your signature parameters will have gone up.
Your fitness signature parameters will go up and down depending on your training loads. With good and complete data, the system will determine the exisiting training and fitness patterns in your historical data and then use this to predict the changes in your fitness as you train.
Xert will then apply a decay. If you train on a regular basis, this decay will not be apparent. But if you go for longer periods, the change relative to the expect value will be more noticeable and will depend on your Signature Decay Method setting:
There are 4 options when selecting a decay method:
Decay Method Description No Decay – Training Load Matched The No Decay method can be used during periods where you are training but not performing any maximal efforts, AND you wish to have the system track your increases & decreases in fitness signature more precisely over this period. Using this method will tell the system to increase/decrease your signature parameters as your training load increases/decreases. WARNING: If you use this decay method over longer periods, particularly if anomalies exist in your data (even subtle ones), your fitness signature may end up being higher than what you can achieve and you will no longer be able to obtain a fitness breakthrough. If you are using this setting and haven’t seen a breakthrough in a while despite many efforts, you may want to choose another decay method.
Small Decay This decay method falls in between Optimal and No Decay and can be used to fine tune your signature to reduce the impact of a decay, for training purposes. Optimal Decay – Default This is the default decay method used by the system. It will follow your breakthroughs and your training loads as they move up and down. It has an additional decay that will still express your fitness in cases where your signature numbers have inadvertently become too high. This ensures that your progression data stays accurate and provides opportunities for breakthroughs to validate your progress. Optimal Decay can be used during all phases of your Training Program, but it is most effective during Build and Peak phases when fitness breakthroughs are more frequently. No Decay is preferred during the Base phase in general.
Aggressive Decay This decay method will trigger more breakthroughs and variation in your progression to help identify potential decreases or increases that may be missed when using the other methods. A Signature Decay Method is needed to ensure errors in your data don’t cause an overestimation of your fitness signature parameters. If your predicted values have been overestimated (could be due to a variety of circumstances), having a decay will assist in helping you become aware of the impact this has had on your fitness signature.
- Specificity Rating
Specificity Rating is a percentage value that provides further detail on a Focus. Specificity Rating characterizes how closely the strain accumulated during an activity matches precise work allocation ratios. A 100% specificity rating is Pure and means that all the strain accumulated was at the power on the Power Duration chart associated with the Focus Duration. A 0% specificity rating is Polar and means that all the strain accumulated was either at Peak Power or below Threshold Power. Generally speaking, cycling often has specificity ratings that are in-between pure and polar. These are classified as Mixed.
- Pure = 100% – 67%
- Mixed = 67% – 33%
- Polar = 33% – 0%
Ultra-Short Race Pace Training (USRPT), for instance, is an example of training at a pure specificity rating. Training is done at intensities that match a given intensity only.
One way to conceptualize, Specificity Rating, especially if you plan on performing adhoc workouts:
- Pure – You spent a majority of your time at or near the Focus intensity.
- Polar – You spent a majority of your time at Endurance intensity with efforts above your Focus intensity.
- Mixed – You had a mix of Endurance, Focus intensity and efforts above and below it.
You can fine tune your riding/running on the fly in achieving the target Focus or choose your workout by using these concepts.
- Starting Training Load

This value available under Account Settings / Profile, represents the total Training Load that you had at the time of your very first activity on the system. Since there is no data previous to this, you should adjust this value to be what your Training Load was most likely to have been at that time. If you’re not sure, enable Calculate an Estimate to allow the system to calculate one for you. The system will use your average daily XSS for your entire activity history as an estimate of your training load.
Changing the value will affect the relationship between Training Loads and your Fitness Signature variables at the beginning of your progression history in the system.
- Strain
Measured in joules, this quantifies how much work is performed close to MPA. As MPA drops with fatigue, strain increases at the same intensity. Each joule of strain can be divided into low, high and peak strain according work allocation ratios, based on per second work (equivalently each second’s power data value).
When strain is normalized to equal 100 points for one-hour of unfatigued work at Threshold Power, it is referred as Xert Strain Score.
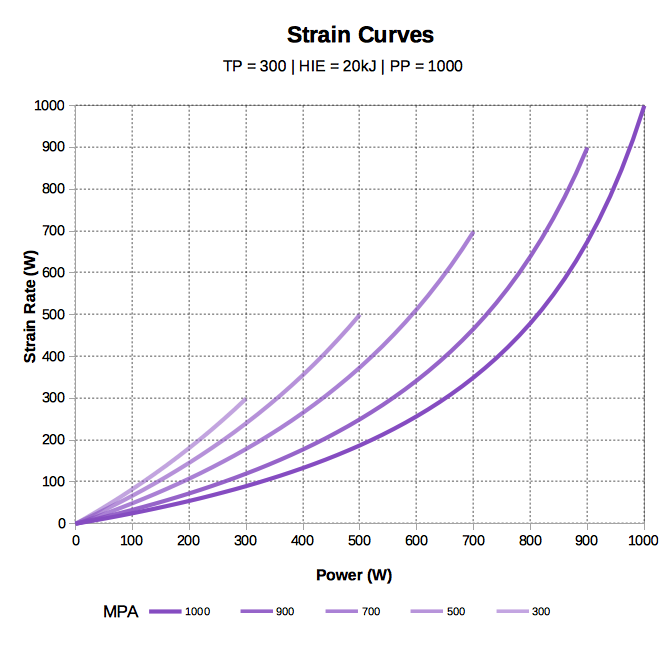
- Stress
Synonymous with work, this metric is measured in joules and is the total work performed over a given period or activity. Using work allocation ratios, stress can be divided into low, high and peak stress over any period.
- Taper
What is a Taper?
A “taper” refers to a period of reduced training intensity and volume that athletes undergo in the days or weeks leading up to a major competition or race. The purpose of tapering is to allow the body to recover from the accumulated fatigue of training while maintaining and enhancing the fitness gains achieved during the training phase. This strategy is aimed at optimizing an athlete’s performance on the day of the competition.
During the taper period, athletes gradually decrease the frequency, duration, and intensity of their workouts. This reduction in training load allows the body to repair and recover, replenish energy stores, and minimize the risk of overuse injuries. The tapering phase can vary in length, typically ranging from about one to three weeks, depending on the athlete’s training history, the distance of the race, and individual preferences.
Why Taper?

Key goals and benefits of tapering include:
- Recovery: Tapering helps reduce the accumulated fatigue from intense training sessions, allowing the body to heal and rejuvenate.
- Muscle Repair: The reduction in training stress during tapering allows for repair of microscopic muscle damage caused by training.
- Energy Restoration: Tapering gives the body a chance to replenish glycogen stores (energy stored in muscles) that may have been depleted during training.
- Performance Enhancement: By reducing fatigue and optimizing physiological systems, tapering can lead to improved performance on race day.
- Mental Readiness: Tapering allows athletes to mentally prepare for the upcoming competition and enter the event with a fresh and confident mindset.
- Maintaining Fitness: While reducing training, tapering aims to maintain the fitness gains achieved during the training phase, ensuring athletes are at their peak performance level on race day.
Adjusting your Taper with Xert
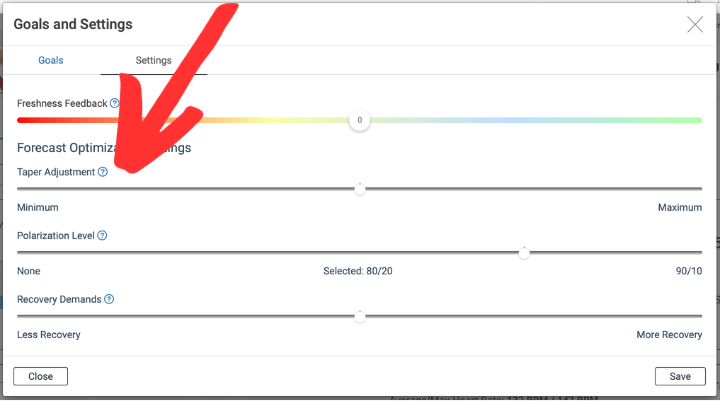
It’s important to note that tapering is a delicate balance. Too little tapering might result in athletes not fully recovering, leading to suboptimal performance due to lingering fatigue. On the other hand, tapering too much or too early can lead to detraining, where the body loses some of the fitness gains achieved during training. Therefore, finding the right balance and tailoring the tapering strategy to the individual athlete’s needs and the specific event is crucial for successful performance in endurance sports.
- To increase your taper, you can move the slider to the right. This will also reduce your recovery needs after your event (since you arrived at your Target Event with additional freshness).
- To decrease your taper, move the slider to the left. Xert will give you a shorter & less aggressive taper period. Note: this may increase the recovery needed after your target event.
- Target Event Achievability
Achievability is determined by evaluating a number of different aspects about you, your historical performance and training patterns, the target event date and the nature of the improvements you are looking for by that time.
In this step of the set up guide, Forecast AI attempts to estimate whether the event you’ve selected – event date, type, terrain, duration and your maximum weekly hours – can be achieved. Forecast AI estimates the Training Loads needed in order to perform the race with the given Event Readiness.
You’ll notice that as the Event Duration increases, so does the Total XSS with Low, High and Peak XSS adjusting up/down based on the type of event you choose. Some events require more of one type of fitness compared to the other. Events will put demands on each system and they will need to be trained sufficiently so that you’re not over-taxing them during the event. Forecast AI estimates how much strain the event will place on each system and how much training you’ll need to do in order to prepare.
If the increases in your Low, High and Peak Training Loads can be achieved by the target date, you will see:

This indicates that by following the training plan generated, the Target Training Loads will likely be reached by the date and that reaching these training loads will enable you to complete the event at the Event Readiness level indicated. Note that you’ll need to Run Forecast AI before achievability can be further asserted and a plan to reach the target event created.
The larger the XSS demands of the event you wish to plan for, or the higher the Event Readiness, the longer it will take to reach and the more number of weekly hours will be needed. Depending on the event/terrain you choose, will determine which of the training loads need to increase to help you prepare for the event.
If the event cannot be reached in time, the individual training loads in question will be identfied and you will see:

If you don’t have enough hours to train:

- Target Event Date
This is the date of your target event and establishes the end of your Training Program. Your program phases are dependent upon your selected Target Event Date.
You can change your target event date by selecting the Goals button on the home page of XertOnline, or by navigating to Account Settings > Personal Info > Target Event Date.
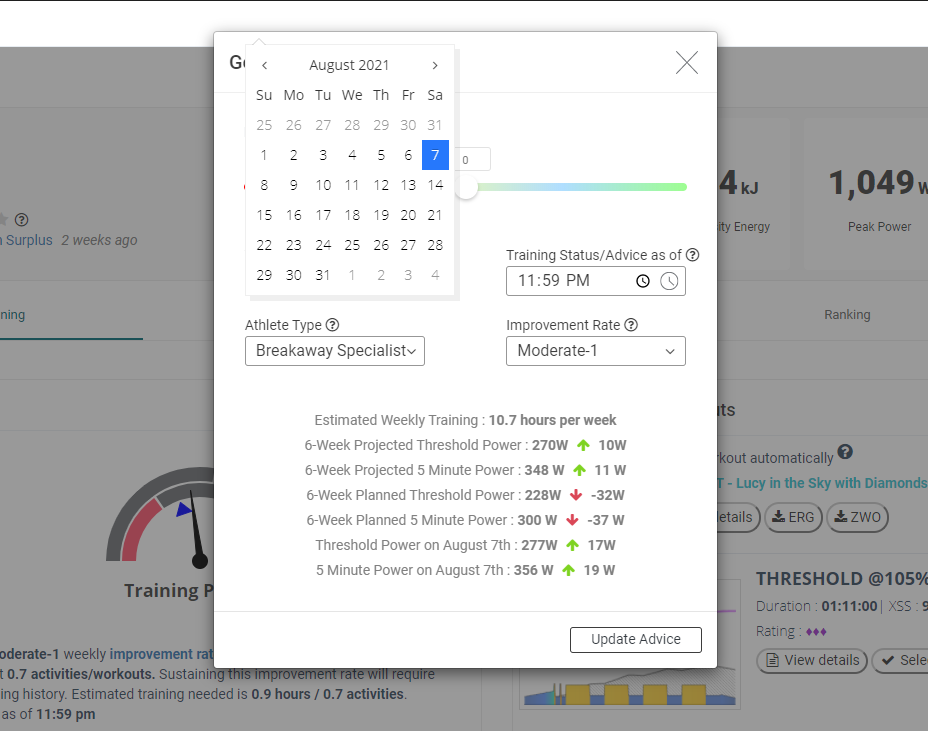
- Target Goal Achievability
Achievability is determined by evaluating a number of different aspects about you, your historical performance and training patterns, the target goal date and the nature of the improvements you are looking for by that time.
In this step of the set up guide, Forecast AI attempts to estimate whether the goal you’ve selected – goal date, focus, power increase / specificity and your maximum weekly hours – can be achieved. Forecast AI estimates the fitness signature needed to reach these results. If the increases in your Threshold Power, High Intensity Energy and Peak Power can be achieved by the target date, you will see:

This indicates that if you following the generated training plan, the Target Fitness Signature will most likely be reached by the date and that this fitness level will enable you to reach the power goal you have selected. Note that you’ll need to Run Forecast AI before achievability can be further asserted and a training plan to reach the goal created.
The larger the increase in power you look for, the longer it will take to reach the goal and the more number of weekly hours will be needed. Depending on the focus/specificity you choose, will determine which of the 3 fitness signature values need to increase to best achieve the goal.
If the goal cannot be reached in time, the parameters that are in question will be indicated and you will see:

If reaching the goal will depend on factors that cannot be assessed immediately, you will see:

or if you don’t have enough hours to train:
- Target MPA
Target MPA, or TMPA, is used in the definition of some SMART intervals in the Xert Workout Designer. TMPA represents your ending MPA value for a given workout interval. TMPA can be used as a SMART variable-duration or a SMART variable-power interval. This allows Xert to modify the power target or duration of an interval in real-time while you’re doing the workout. For more detailed information, continue reading further below.
Target MPA based intervals can be used for both high intensity efforts (where MPA declines) and recovery intervals (where MPA rises), where the target power is above and below TP, respectively.
Workouts with TMPA Intervals
Target MPA intervals are only supported for the Xert EBC apps and Xert Player for Connect IQ, which support the ability to manage fatigue in order to ensure the Target MPA is reached during workouts. Calculations are based upon whether the interval has a declining or rising MPA value.
For example, if an interval has a declining MPA to a given Target MPA level, the players will speed up interval time or decrease the target power if the athlete maintains a power above the target power (for SMART duration & SMART power, respectively). On the other hand, the apps will slow down interval time or increase the target power if the athlete maintains a power below the target power for the interval (for SMART duration & SMART power, respectively).
Conversely, during rising MPA intervals, interval time will speed up or increase the target power if that athlete maintains a power below the target power and will slow down the timer or decrease the target power if the athlete maintains a power above the target power. These dynamically managed fatigue intervals help ensure that the athlete achieves the goals as determined by the workout design.
SMART – Elastic Heart – 3.5 is a modified VO2max workout that uses Target MPA intervals rather than %FTP for the VO2max interval targets. As you progress through the interval, Xert will adjust the power target up (or down) such that you finish the interval at the Targeted MPA (60% Reserve – shown in the interval steps below).
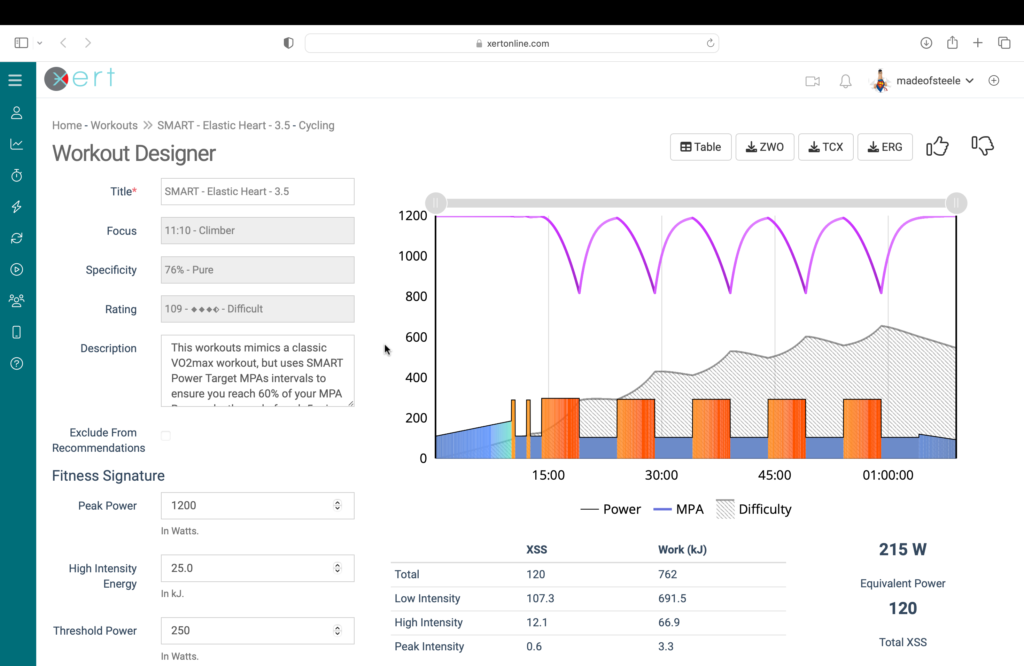
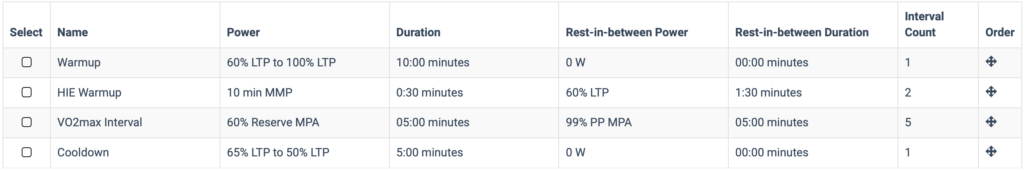
For more information on SMART workouts, check out our blog post on SMART workouts, here.
- Threshold Power
Threshold Power, also used as an acronym TP in Xert and sometimes described using the more colloquial term FTP, Threshold Power is a parameter of your Fitness Signature that represents the highest power that can be sustained without accumulating short-term fatigue – e.g. without MPA decreasing. Threshold Power can generally be sustained for just under an hour by most athletes, assuming that the discomfort generated is tolerable by the athlete over the entire period.
Worthy of note is that Threshold Power is affected by work performed, with work performed at higher intensities having greater affect. This must be true otherwise it could be sustainable at any time, even after an hour of high intensity effort.
- Time to Exhaustion
Time to Exhaustion (TTE), also referred to as time-to-failure, it is the time remaining, at a given work rate (power or intensity) before the given work rate cannot be maintained. For example, TTE at 500 W could be determined to be 60 seconds. This means that if you were to start an effort at 500 W, you could sustain it for 60 seconds before you wouldn’t be able to sustain 500W and reach a point-of-failure. From an MPA perspective, after 60 seconds at 500 W, MPA would be 500 W.
N.B. The term “exhaustion” is used but in many cases, particularly at very high intensities, failure is reached before the feeling of exhaustion. Say for example, that your TTE at 1000 watts is 10 seconds. After 10 seconds at 1000 watts, you would be unable to sustain 1000 watts. However, you could still produce just under 1000 watts and would not yet feel exhausted, despite the inability to sustain the power. TTE as used in this scenario but would more appropriately be termed time-to-failure and not TTE. TTE has been selected as it is a more familiar term and concept.
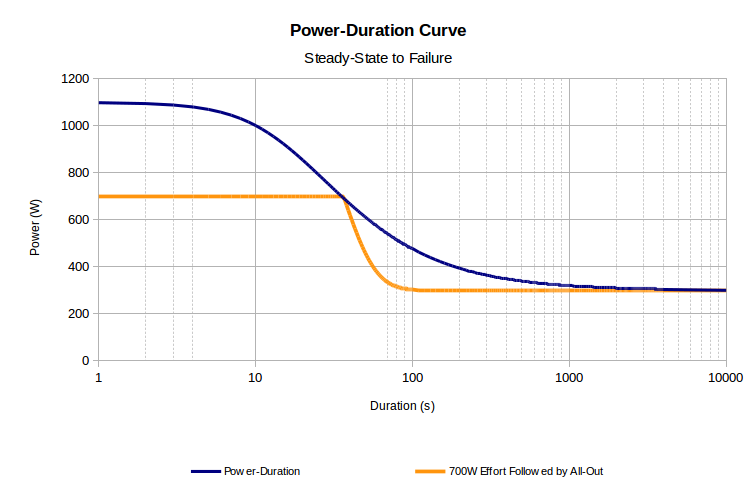
- Time to Recovery
Time to Recovery (TTR) represents the amount of time to recover from a high-intensity effort. Time to recover can also be associated with a recovery intensity. For example, TTR at rest (0 W) is shorter than TTR at 150 W, assuming Threshold Power is above 150 W. That is, you recover sooner at 0 W than you do at 150 W. Using a recovery power other than 0 W is useful to keep track of how long it will take to recover while still producing power, such as riding in a group behind the draft. Recovery power cannot be greater than or equal to Threshold Power.
TTR is a key feature in workout design using Target MPA.
- TL
See Training Load.
- TP
See Threshold Power.
- Training Advice/Status As Of
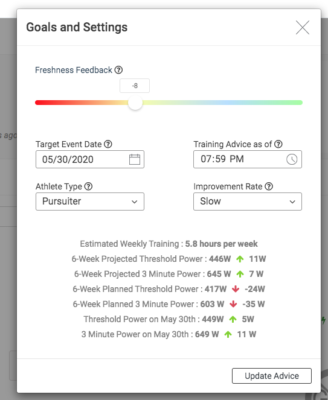 Training Advice As Of and Training Status As Of are the same value and are used in the Training Advisor and Fitness Planner. To simply the understanding of how the system determines Training Status and offers advice, this user-defined time value enables you to decide at what time during the day should the advice/status be based on.
For example, you can set this value to 11:59 PM (current default), to have the system show you what your Training Status will be at the end of the day for each day when viewing the Fitness Planner. You’ll get the training advice (XSS Deficits and recommendations) based on that time as well. Note that your current Training Status or current Advice might be a bit different that what it will be at 11:59PM. Alternatively, you could set the value to 00:01 AM so that you get the training advice for the start of the day. This can be just as effective.
You can also experiment with different values during the day in order to assess your training status or the advice as appropriate for preparation for an event or for fine-tuning the advice you want to get.
- Training Availability
Training Availability in Xert lets you personalize your training plan to fit your schedule. Whether you’re juggling work, family, or other commitments, you can specify when you’re available to train and for how long – and Forecast AI (XFAI) will automatically adapt your plan around it. Your availability is also considered by the Xert Adaptive Training Advisor (XATA), alongside your current XSS Deficit or surplus, to recommend the right amount of training within your available time.
How it works
Xert first looks at your historical training habits – when you typically train and for how long – and uses that to inform your plan. For example:
- If you usually do short weekday rides and long weekend rides, your training plan will reflect that pattern.
- However, you can override your default schedule by manually adjusting your availability – either for individual days or recurring weekly patterns.
Let’s walk through how to update your Training Availability.
Set Weekly Availability (from Profile Settings)
- Go to Profile Settings.
- Under the General tab, scroll to Weekly Availability.
- Customize your availability for each day of the week:
- Time of day
- Duration
- Availability (Available / Unavailable)
- Fixed vs. Flexible (more below)
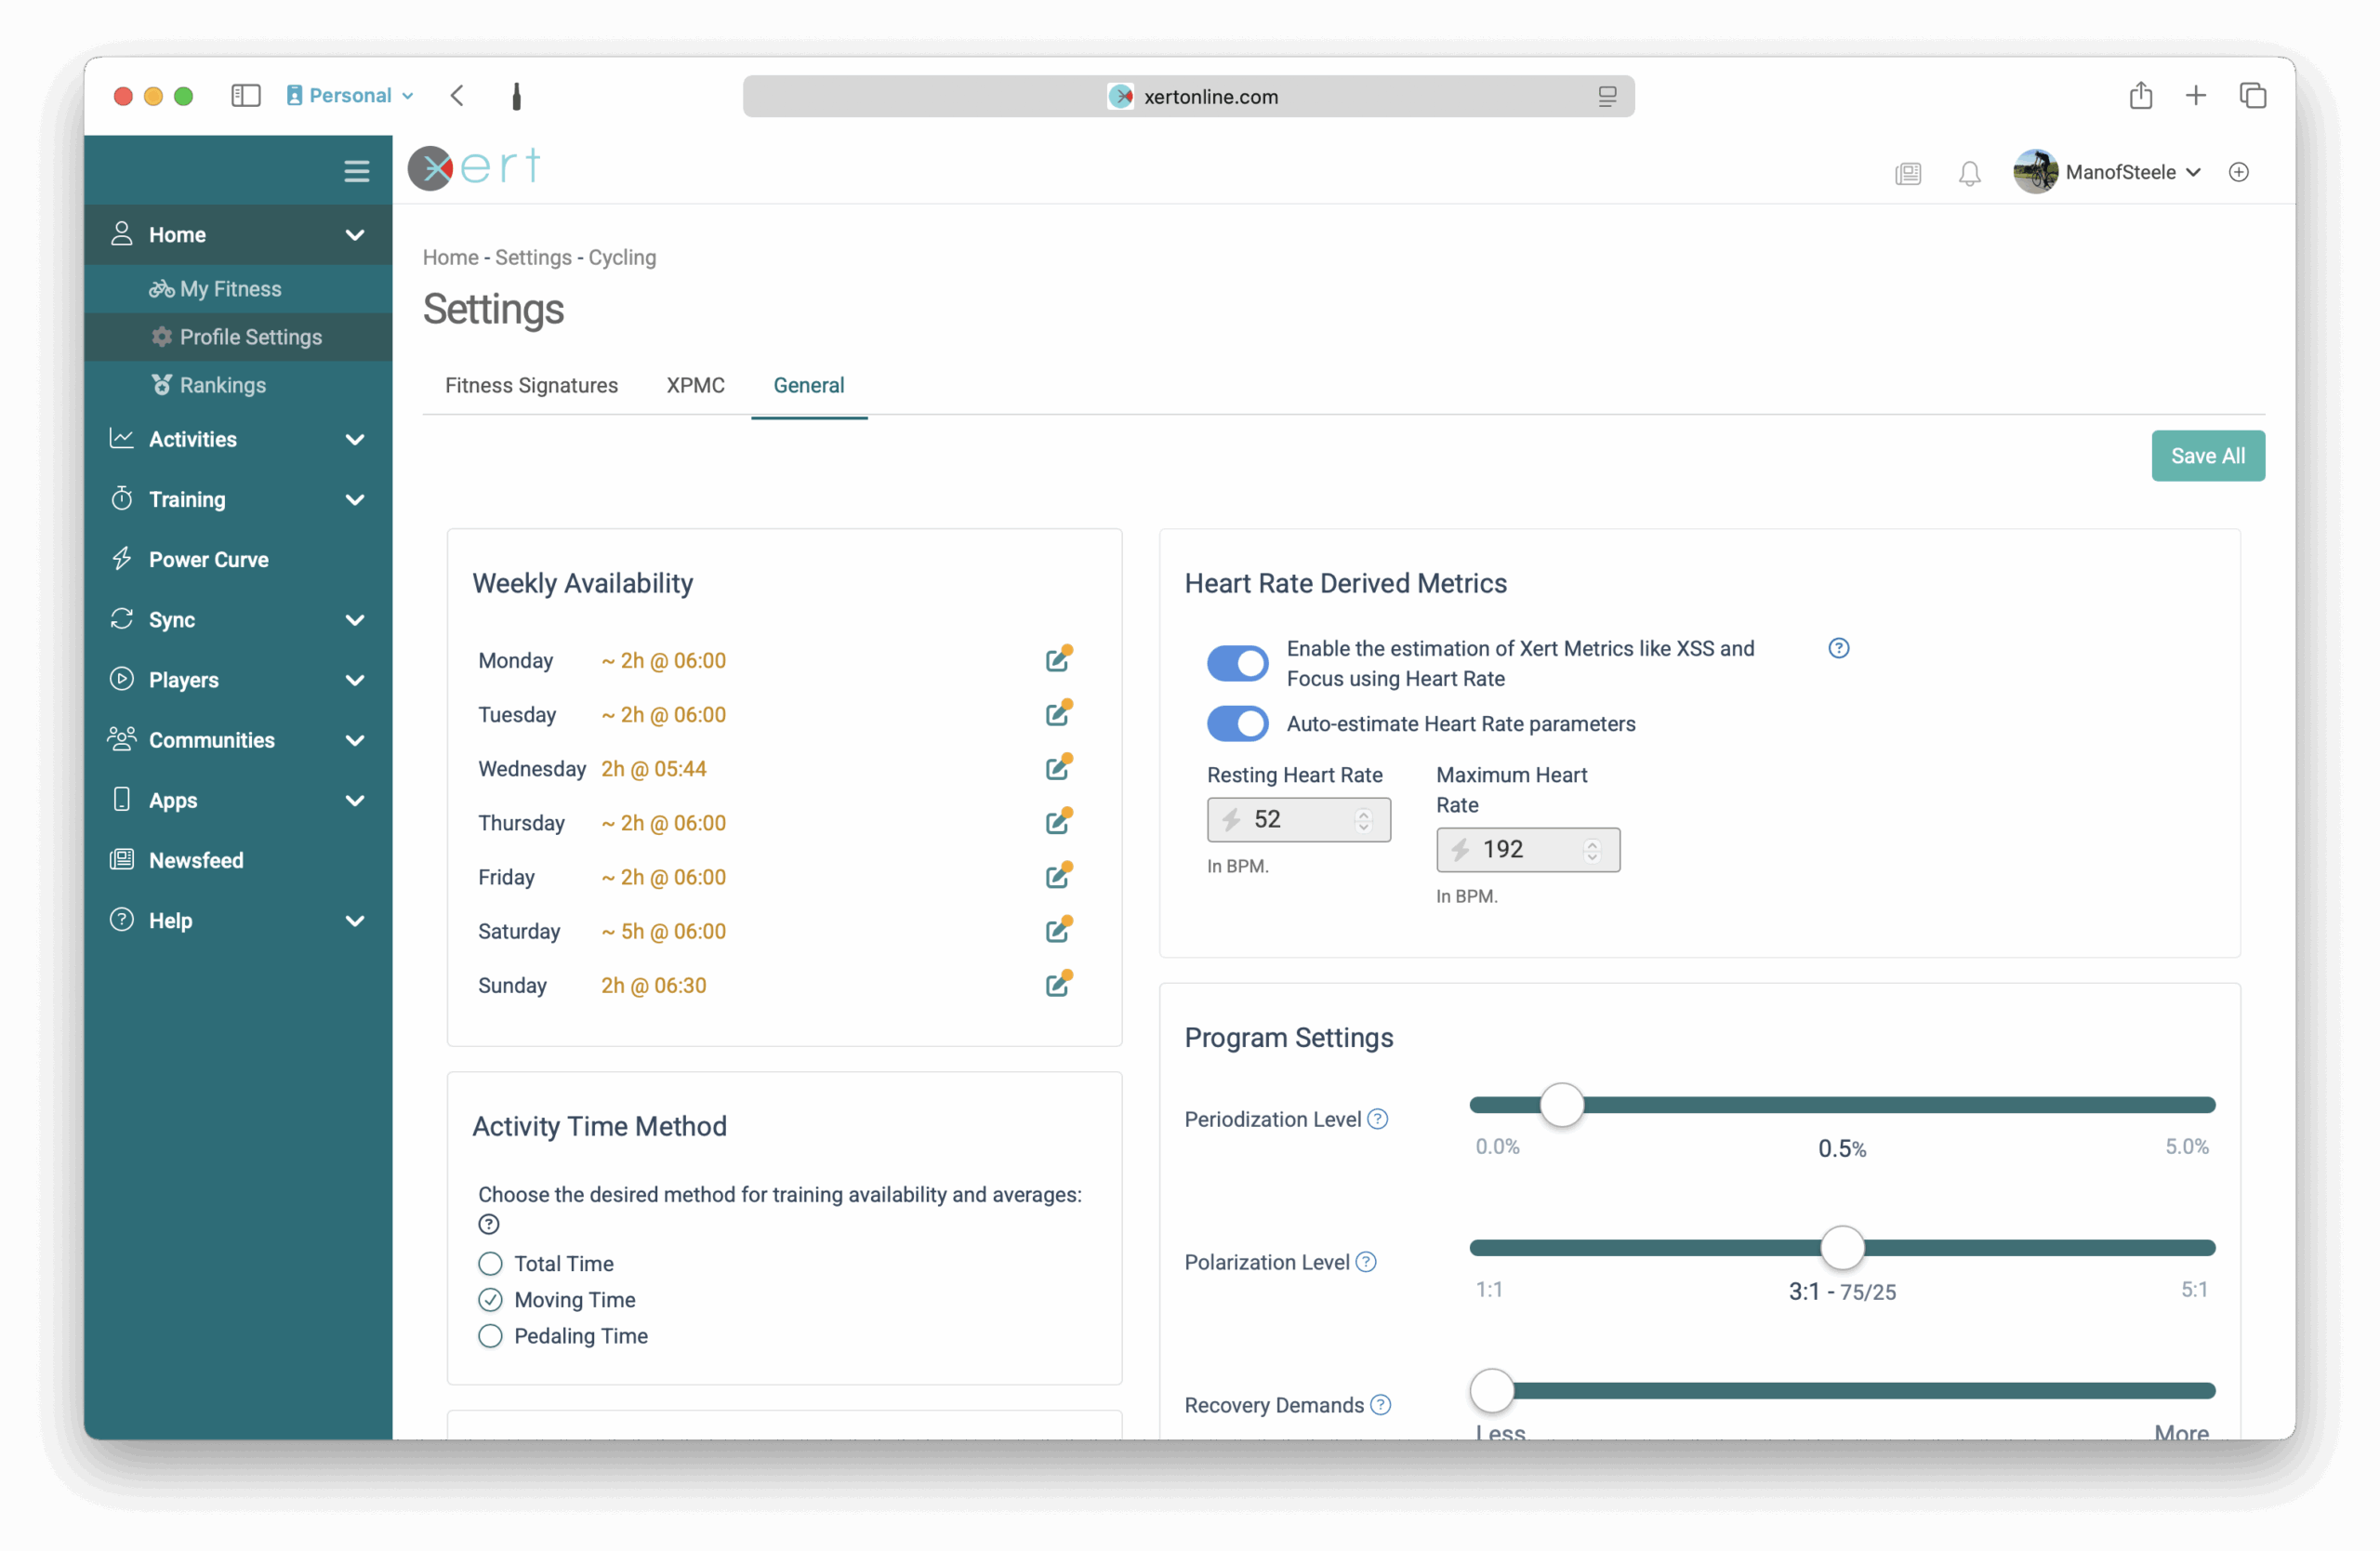
Adjust Specific Days (from the Fitness Planner)
- Open the Fitness Planner.
- Click on the day you want to modify, if on desktop/laptop. No hover necessary on mobile view.
- Select the Clock icon to open the Training Availability panel.
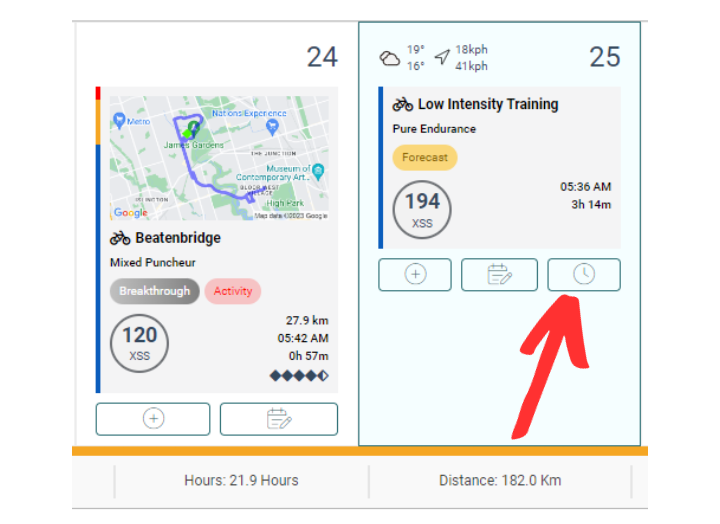
Here, you can configure:
- Availability: Mark yourself as Available or Unavailable for training that day.
- Time: Specify the time of day you plan to train (morning vs. evening can affect training readiness and recommendations).
- Duration: Set how much time you’re available to train.
- Use Advisor uses your typical training duration for that day.
- Fixed vs. Flexible:
- Fixed: Locks your availability to the selected duration throughout the plan.
- Flexible: Allows Forecast AI to increase training time on that day as training demands increase over time.
- Apply Weekly: Enable the “Default for [day of the week]” toggle if you want this setting to apply to all matching days in your plan.
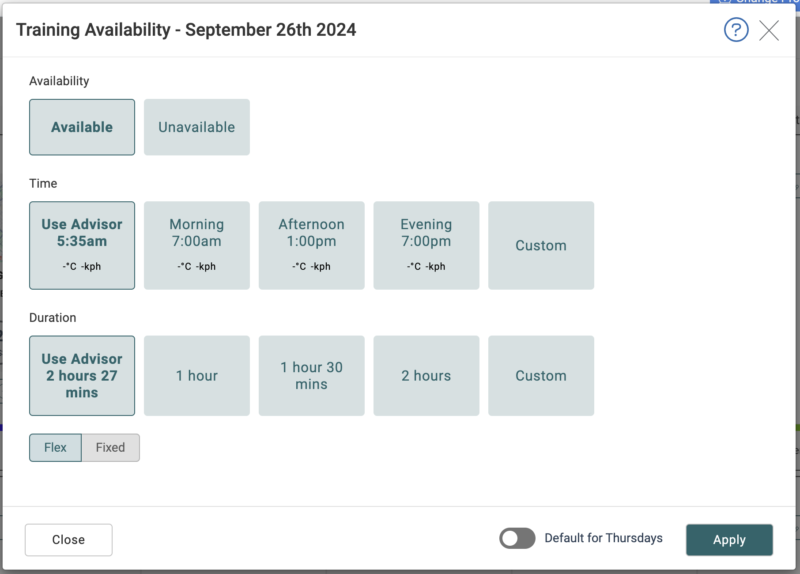
💡 Tip: The duration of your actual workout or activity may differ from your set availability. Riding at a higher intensity can reduce the time needed to achieve your XSS target, while easier efforts may require more time.
Update Your Plan (Adapt Forecast)
After updating your availability:
- Click Adapt Forecast.
- Forecast AI will rebuild your training plan to match your updated schedule.
⚠️ Keep in mind: If you mark too many days as Unavailable, Forecast AI may be unable to meet your training goals.
Last Updated: 2 September 2025
- Training Deficit
- Training Deficit and Surplus
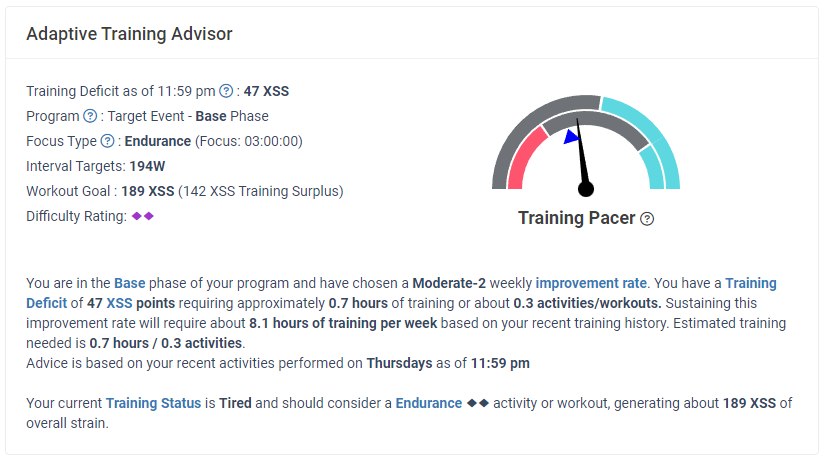
The Xert Adaptive Training Advisor determines if you need to train or if you can afford to take some time off in order to meet your Improvement Rate goals. By comparing the amount of training you have done versus the training required to meet the Improvement Rate, Xert then calculates how much below (a deficit) or above (a surplus) you are using your As Of time, compared to your weekly Improvement Rate goal. This provides you some feedback regarding the amount of training needed to achieve the improvement you’re looking for, and continue progressing your fitness.
The surplus & deficit value is calculated based on your past week of training and does not carry over, meaning if you missed reaching your target last week, Xert will not force you to make up for it this week. Similarly, if you exceeded your Improvement Rate over the previous week, that doesn’t mean you can stop training this week. The amount of training you need to perform is calculated on the current week (a rolling 7 day window). If you performed high XSS activities or workouts about a week ago you should expect to see more variability in your calculated deficit/surplus numbers. This is normal as the XATA encourages you to keep progressing week-to-week based on the elevated levels your previous training achieved.
If you start to fall behind with a large deficit, the XATA will boost your Workout Goal to encourage you to reduce the deficit. If you are finding it too difficult to close your daily XSS deficit, your Improvement Rate may be set too high – consider lowing it. On the other hand, if you are finding you often have a large surplus and the XATA is giving you more time off than you’d like, your Improvement Rate may be set too low – try increasing it.
To read more on returning to training after a break, read our blog post here!
- Training Load
Training Load, also referred to as TL, and a component of the XPMC, this represents the exponentially-weighted moving average of activity XSS values based on the Training Load Time Constant. It is subdivided into Peak, High and Low Training Loads. It is analogous to Chronic Training Load (CTL) in the Banister Impulse Response Model.
- Training Responsiveness
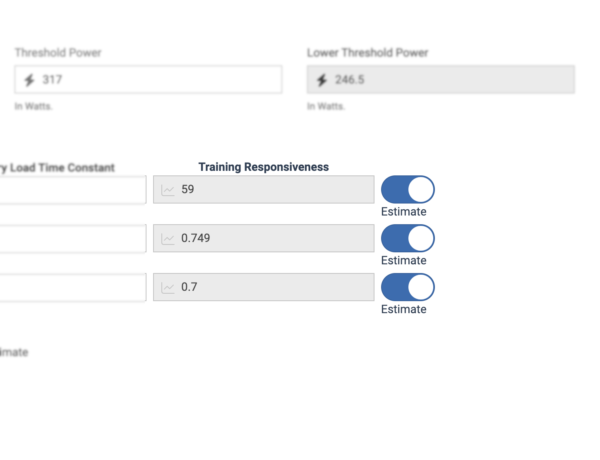
Training Responsiveness are values that represent how a specific Fitness Signature parameter changes with the associated Training Load. Xert performs a historical data regression (i.e. statistical calculation) automatically with each fitness breakthrough to estimate these values. The values are a reflection of how you personally respond to training. Higher values mean you respond more rapidly to increases in training, whereas lower values mean you may not respond so quickly. To estimate these values, the system looks back at your historical data to look for patterns.
If you have robust (i.e. accurate and complete) historical data, these numbers will more accurately reflect how you respond to training. However, if your data has errors or may not be complete, these may need to be adjusted. Click the Estimate toggle to experiment with them. For best results however, consult with Xert support (support@xertonline.com) for assistance in making changes to these values.
Generally speaking, the greater the training responsiveness value, the greater we expect to see that fitness signature parameter increase when its respective training load increases. In the example above, you can see that the training responsiveness for this athlete’s Peak Power is 59 which means that for each point of Peak Training Load, Xert predicts your Peak Power to increase by 59 Watts. This prediction is then validated and updated each time you get a breakthrough. Similarly, there are responsiveness values for High Intensity Energy and Threshold Power, shown as 0.749 and 0.7 above as examples respectively.
Training Responsiveness has been introduced in support of new features that are currently under development.
- Training Status
- Training Status and Form
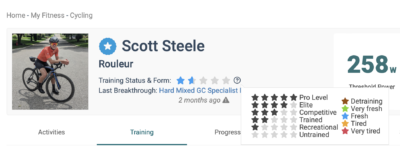 This provides a simpler way to view current Training Load and Recovery Load. The number of stars indicate the total amount of Training Load you have accumulated. The colour indicates the Form. Freshness Feedback is used to offset your Form proportionally using your individual Training Loads.
Training Status Stars
0 Stars – Untrained: Training Load below 25
1 Star – Recreational: Training Load between 25 & 50
2 Stars – Trained: Training Load between 50 & 75
3 Stars – Competitive: Training Load between 75 & 110
4 Stars – Elite: Training Load between 110 & 150
5 Stars – Pro Level: Training Load above 150NOTE: Freshness and tiredness status are representative of your data and NOT what you’re feeling. The algorithm doesn’t know what other training you may be doing or what other conditions you may have. ALWAYS account for how you are feeling in deciding how to use the Training Status and Form indicators and recommendations based on them.
Form
Unlike other training platforms which measure all training stress across one dimension, Xert tracks training strain across 3 separate energy systems: Low (which corresponds with Threshold Power system), High (which corresponds with High Intensity Energy system), and Peak (which corresponds with Peak Power). This allows Xert to more precisely track your fatigue and provide better training recommendations. With the addition of the Recovery Demands, you can fine-tune the system’s calculation of form to align with your self-perceived level of fatigue.
Status Description XATA Recommended Training Advice Freshness Brown – Detraining: 7 Days without recorded activity Green – Very Fresh: All systems prepared for big activity or training session
Blue – Fresh: Low & High/Peak systems ready for training
High Intensity Training, periodized based on Athlete Type and/or Program Phase Tiredness Yellow – Tired: Low intensity system ready for training; High/Peak energy systems need more recovery Red – Very Tired: Low & High/Peak systems too tired to train
Yellow – Endurance Workouts (intensity below Threshold Power) Red – Active Recovery Workouts
Xert Adaptive Training Advisor Programs
For athletes using the Continuous Improvement, Challenge, or 120 Target Event Date Training, Xert will recommend training based on your specific training status, as outlined above.
Xert Forecast AI Training Programs
For athletes using the new Forecast AI Training Programs, Xert will schedule your training in such a way that high intensity training will only be recommended when training status is fresh, and that no training is recommended when training status is red. The intensity of workouts & days to recover will depend on the Focus & Specificity of your specific Target Event or Power Goal, as well as your selected Polarization Level.
You can display the ‘Form‘ line in the Forecast Chart. If you hover over the form at the bottom of a completed activity, Xert will display the recovery time in days for each of your 3 energy systems – Low, High, & Peak:

Did you know? If you allow Xert to push your activities to Strava & you have a ForecastAI training program, you’ll get a neat report that provides additional information about your training status. On the right-hand side, you’ll see how long Xert calculates your training status to be Red (0.4 days) and Yellow (2.3 days):
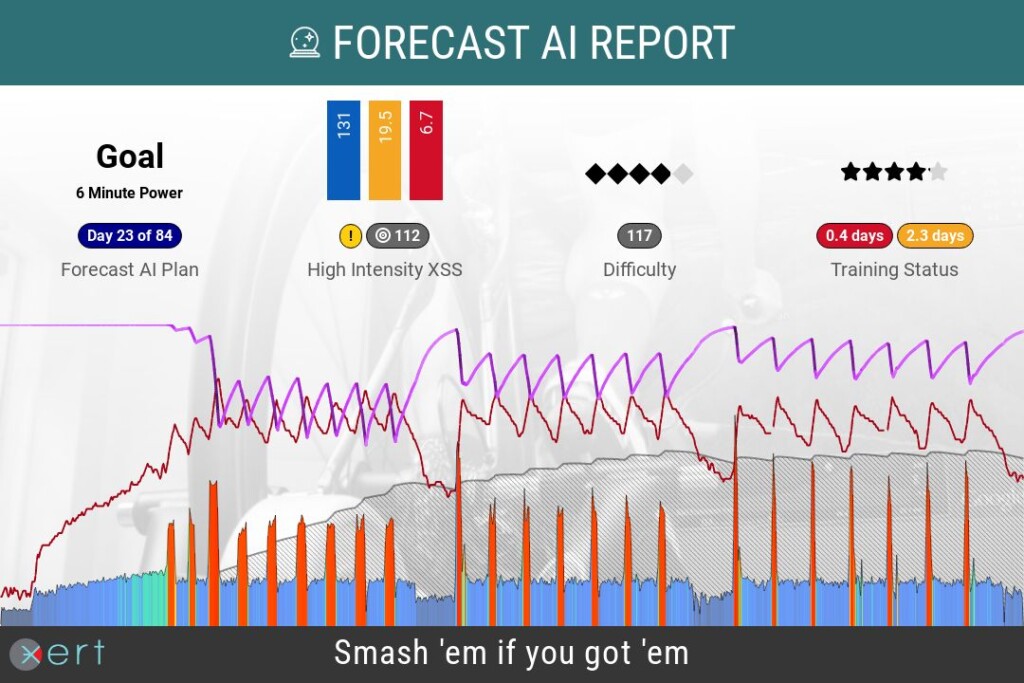
- Training Suitability
Training Suitability or just Suitability provides a way for you to understand how well a proposed workout, activity, or session fits into your Training Program. Not only can Xert recommend workouts, but it can further refine why a particular workout, activity, or session is a good (or poor) fit for your training.
Xert does this by evaluating essential information about each workout, session and activity, such as:
- Is a particular workout or activity too hard or achievable based on its Difficulty Score and your current Training Status?
- Does the workout or activity have sufficient XSS to help you maintain your Improvement Rate?
- Does the workout or activity have the right Focus based on where you are in your Training Program?
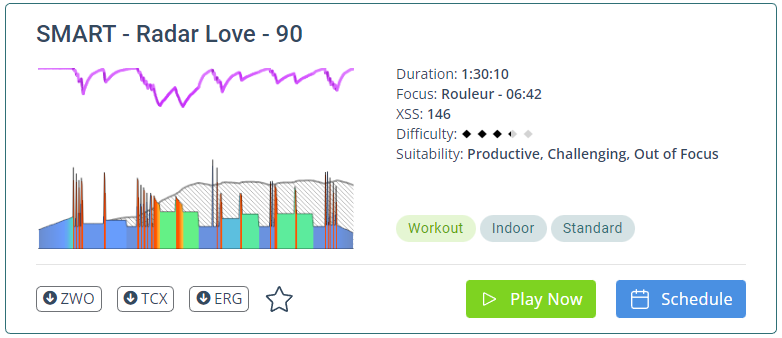
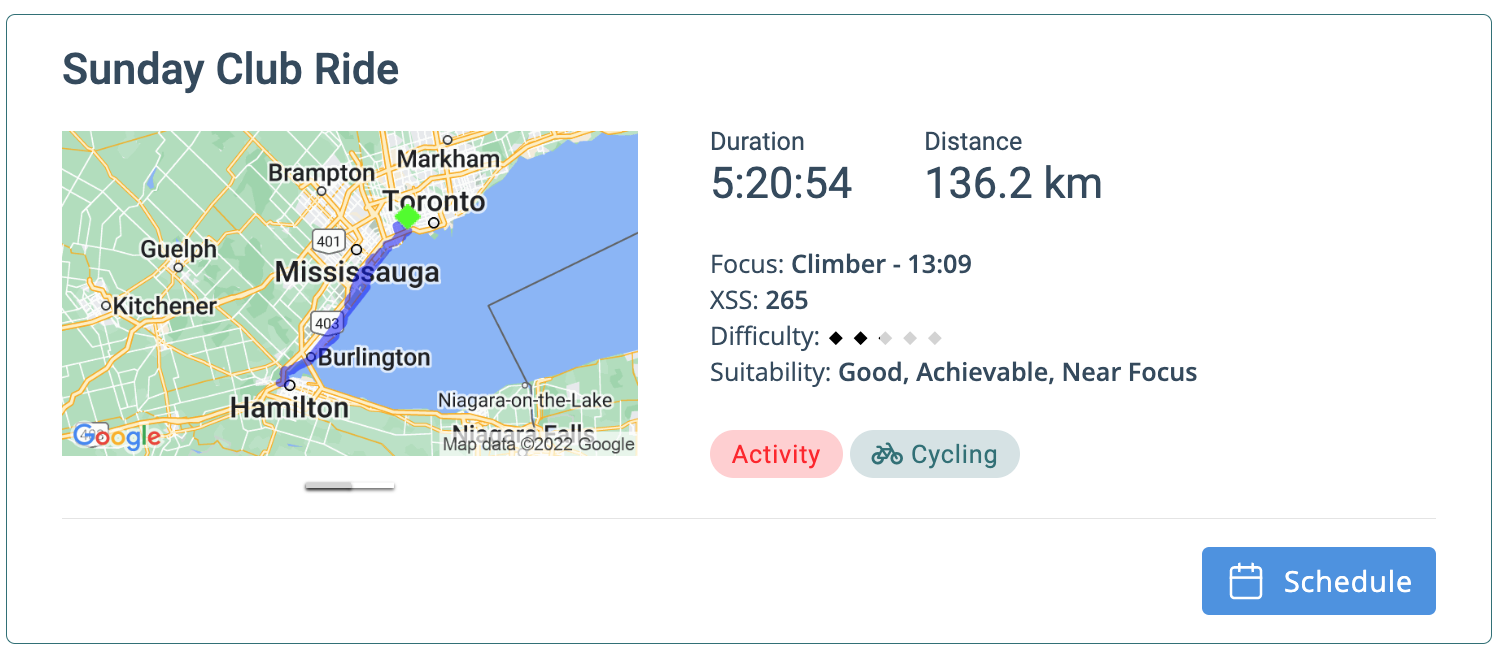

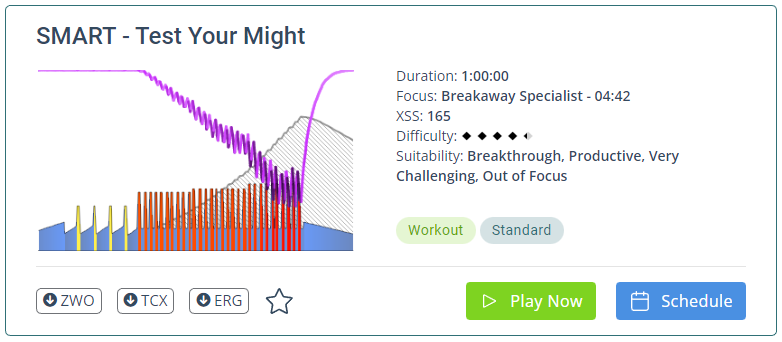
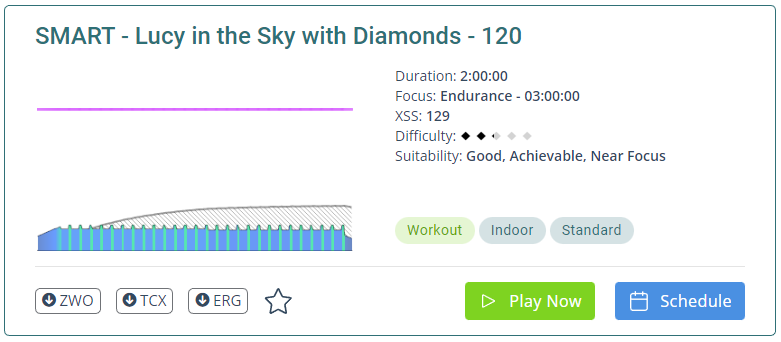
Ultimately, Training Suitability is determined by 3 primary factors: Xert Strain Score (XSS), Difficulty Score, and Focus Duration. We’ll outline some of the terminology you might see under your recommended activities below!
Xert Strain Score (XSS)
- (Very) Productive: XSS of the proposed training is (much) higher than what is necessary to maintain your improvement
- Good: XSS of the proposed training is roughly equal to what is necessary to maintain your improvement
- Fair: XSS of the proposed training is just below what is necessary
- Unproductive: XSS the of proposed training is significantly less than what is necessary
Difficulty Score
- Very Challenging: proposed training will be very challenging to complete based on your current fitness and training status
- Challenging: proposed will be stretching your abilities based on your current fitness and training status
- Achievable: proposed training is achievable based on your fitness and training status

Note: If the workout is a group session, the workouts will be classified as Group Challenging, Group Suitable, or Group Easy
Focus
- Optimal Focus: proposed training matches recommended focus type
- Near Focus: proposed training is close to recommended focus type
- Out of Focus: proposed training does not align with recommended focus type
Lastly, there are some additional tags for our workouts that indicate their suitability, or lack thereof, including Out of Reach, Breakthrough, and Not Recommended.
- Out of Reach: the proposed training cannot be performed; the required power of the workout is significantly higher than your MPA for at least one part of the ride
- Breakthrough: the required power of the workout just meets or slightly exceeds your MPA for at least one part of the ride
- Not Recommended: workout is NOT recommended. These workouts are experimental or help highlight the concepts behind Xert. In general, they should not be part of your training.
- TTE
See Time to Exhaustion.
- TTR
See Time to Recovery.
- Weather Forecast
The updated fitness planner will now display the weather forecast at a quick glance. The weather glance will indicate the daily High/Low temperature and wind/gust speed & direction for the next 5 days.
Also, when planning training or ride in the next 5 days in the fitness planner, you will find a ‘Weather Forecast‘ tab option, which shows more detailed weather information :
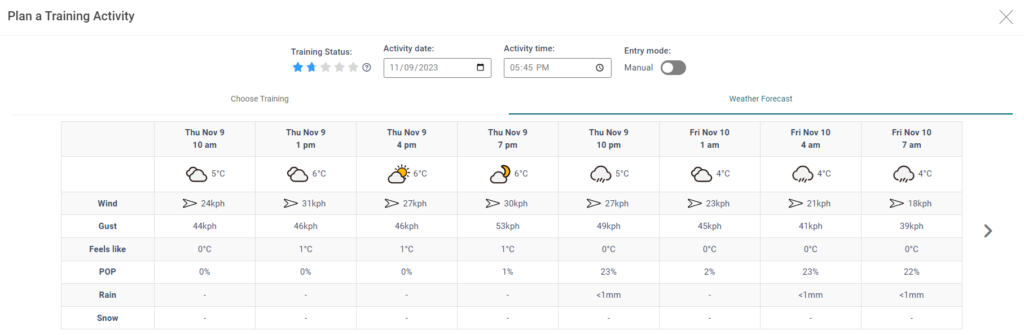
Note: Be sure to enable location permissions from your browser to take advantage of this new feature!
- Work Allocation Ratio
Sometimes referred to as Work Contribution Ratios, these ratios divide work and strain into peak, high and low. Since the three Fitness Signature parameters can be used to determine and predict your maximal power available, an athlete’s ability to perform must work integratively into each of these parameters. That is, each parameter represents an integrated fitness measure and all three together can be used to effectively represent an athlete’s fitness. This is true because MPA, which is derived from the Fitness Signature, is predictive of an athlete’s ability to perform.
Therefore, we can assign for each joule of work performed, how much influence each fitness signature parameter had in the production of the work. Similarly, we can assign for each joule of strain, how much influence each fitness signature parameter had in the generation of that strain. When we do so, we allocate work or strain according to these ratios.
- Low Work / Strain / Training Load / Recovery Load / XSS is determined by Threshold Power
- High Work / Strain / Training Load / Recovery Load / XSS is determined by High Intensity Energy
- Peak Work / Strain / Training Load / Recovery Load / XSS is determined by Peak Power
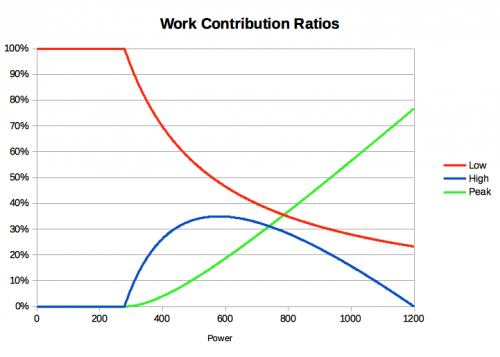
- XATA
The Xert Adaptive Training Advisor is a smart training recommendation engine that factors in many variables obtained from analysis of your data. See Xert Adaptive Training Advisor for more…
- XEP
- Xert Adaptive Training Advisor
The Xert Adaptive Training Advisor (XATA) is a smart training recommendation engine that factors in a wide variety of factors obtained from the analysis of your activity data and your training goals. Upon analyzing these various factors, XATA will provide you with a list of recommended trainings, with the most optimal training presented on top. You can further refine the recommendations using a variety of filters, including duration, difficulty, & Focus type. Xert will then present the best recommended trainings that fall within the confines of the applied filters.
Note: Xert can now also recommend Outdoor Activities & Virtual Rides in addition to structured workouts & sessions! This allows you to incorporate many of your favorite bike routes, group rides, & virtual activities as part of your training program with Xert. You won’t find this anywhere else!
Here are some of the variables that are considered when Xert recommends training:
- Current Training Loads by each system – Low, High, Peak
- Current Recovery Loads by each system – Low, High, Peak
- Current Form by each system – Low, High, Peak
- Overall Training Status
- Your current Fitness Signature, established via MPA Analysis and Fitness Signature extraction, including Threshold Power
- Your freshness – Very Tired to Very Fresh
- The rate at which each Training Load is increasing / decreasing
- Your selected Program Type, which includes:
- Your Target Event Date (if using a TED program type)
- Your selected Athlete Type
- Your desired Improvement Rate
- The phase of your program (if using a TED program type)
- The number of activities you performed recently, including:
- The average duration for your activities
- The XSS you accumulated for each activity type – Workout, Outdoor Ride, & Virtual Ride
With this information, the training advisor then calculates:
- The deficit / surplus of training you have using your As Of time
- The amount of hours you will need to maintain to sustain the improvement rate you have selected
- The target Focus you should have for your next workout, based on your training program or phase
- The recommended Focus based on your target Focus and freshness
- Recommended XSS for your workout, outdoor ride, or virtual ride
- Whether you need a recovery week
- The Difficulty you can handle in your training, based on your current training loads and desired improvement rate
With all this information, each workout is scored based on how they best match your current training needs. From here, the best workouts, favorited activities, and Xert Sessions are chosen and presented as recommended workouts. When you load the workout into one of the Xert Workout Players (Xert EBC for Android/iOS or Xert Workout Player for Garmin), they are personally tuned to your capabilities and training level automatically, adjusting target intensities on-the-fly, ensuring you reach the right targets as you execute the workout.
Any time that new activities are received, or you update your Training Program Type/Target Event Date, your Improvement Rate, or just recover, Xert’s adaptive algorithm will readjust the recommendations in real-time, always ensuring you’re on the right track with your training!
- Xert Equivalent Power
Xert Equivalent Power, also called XEP, this represents the average power that more closely resembles what the athlete experienced during the activity. The more time the athlete spends working near MPA, the higher the XEP value will be relative to the average power.
- Xert Forecast AI
Xert Forecast AI (XFAI) is Xert’s advanced training planner that uses artificial intelligence to automatically build a complete, personalized training plan. Unlike XATA, which recommends what to do today, Forecast AI “forecasts” your entire training journey – from your current fitness level to peak form on your Target Date.
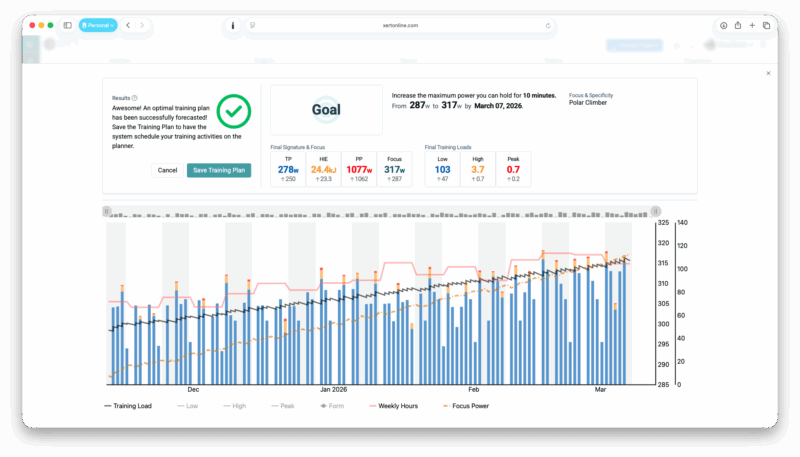
Once you set your Program Type (Goal, Event or Race), Target Date, etc., Forecast AI uses your fitness signature, training history, and availability to generate a detailed day-by-day forecast of your training. This includes your expected daily XSS (Low, High, & Peak), Training Loads, Training Status, and projected Fitness Signature over time.
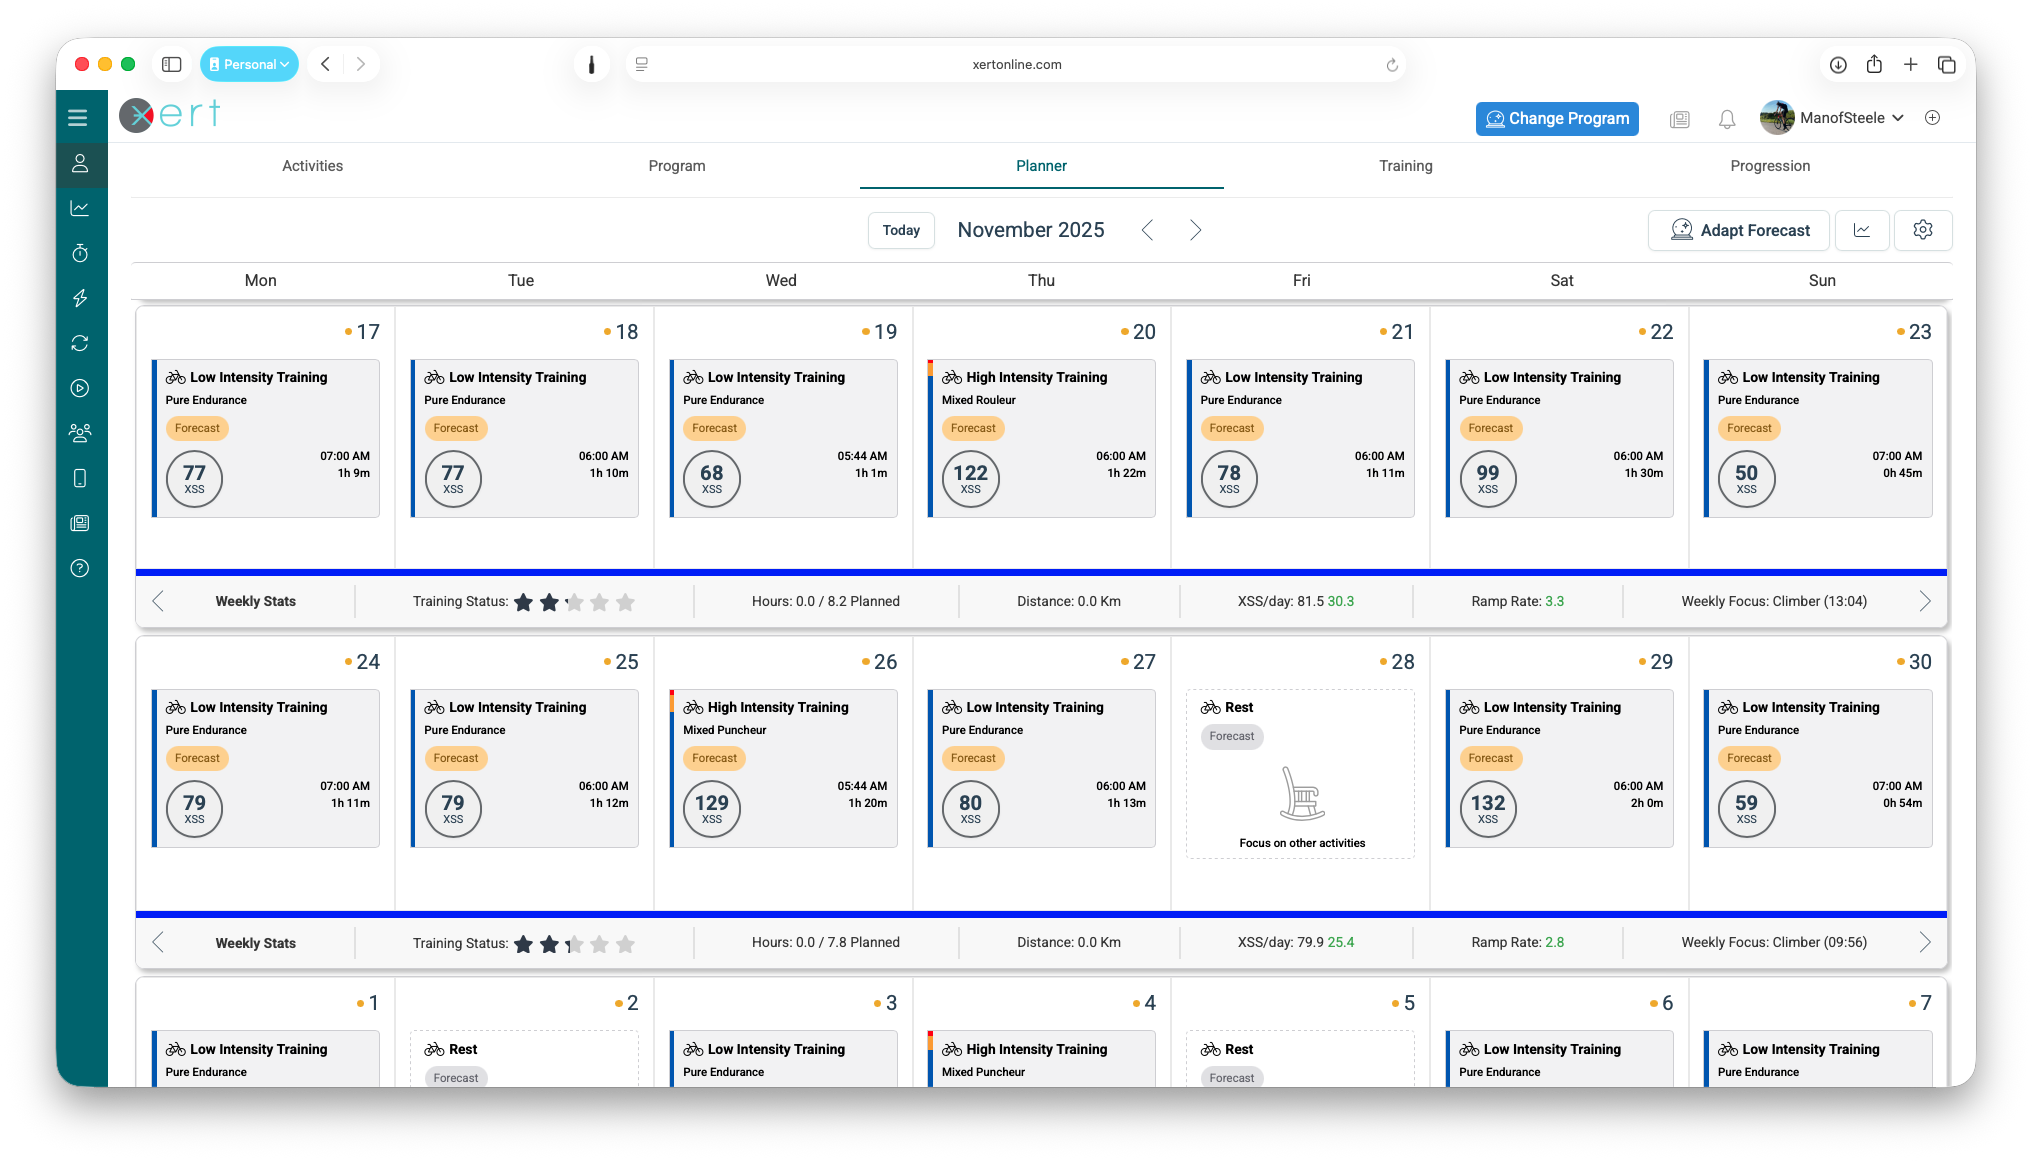
Forecast AI doesn’t simply fill your calendar with workouts – it predicts your progress and assigns XSS accordingly. It can adapt your plan to ensure you arrive at your event in top form, balancing progression, recovery, and event specificity.
Key Features and Capabilities
- AI-Generated Training Forecasts: Forecast AI creates a personalized training plan based on your current fitness and long-term goals, automatically accounting for your available training time and frequency.
- 3-Dimensional Fitness building: Forecast AI helps you train all 3 aspects of your fitness signature, not just FTP!
- Dynamic Adaptation: If your schedule changes or you adjust your training availability, you can click Adapt Forecast to instantly recalculate your plan based on your new inputs.
- Progressive Overload Management: Forecast AI intelligently increases your training volume and intensity over time, ensuring steady improvement without excessive fatigue.
- Event-Specific Peaking: The system adapts your training phases automatically – building base fitness, adding intensity, and tapering your workload as your Target Event Date approaches. The better your event readiness score, the more of a taper you’ll be provided.
- Highly Customizable: Forecast AI allows you to adjust your availability, polarization, periodization, recovery demands, & more!
- Real-Time Visualization & Feedback: Your Xert Fitness Planner displays Forecast AI’s predicted XSS, Training Load, and Fitness Signature progression – showing exactly how your fitness is expected to evolve. After each activity, Xert evaluates your performance against the plan and scores your results as On Target (Green), Slightly Off Target (Orange), or Off Target (Red) across all three energy systems.
How Forecast AI Works
Forecast AI uses your selected Training Availability, Program Type, and Training Parameters to simulate your fitness trajectory based on your desired outcome! It projects how your Low, High, and Peak Training Loads will evolve, predicting your future Threshold Power, HIE, and LTP at your goal date.
Read more about outcome based training plans in our blog article, here!
If you skip a workout, add extra training, or change your availability, the system automatically adjusts your plan when you Adapt Forecast, keeping your training trajectory aligned with your target outcomes.
When to Use Forecast AI
- You have a specific race, event, or performance goal.
- You want to see how your training today impacts your fitness weeks or months from now.
- You wish to see all your training for the coming weeks (or more) laid out clearly in front of you.
- You prefer a data-driven plan that adapts to your schedule and recovery automatically.
- You want to see how you will reach a desired outcome or prepare for a particular race.
If you prefer to plan day to day or one week at a time, XATA remains your go-to day-to-day advisor. But for long-term planning, Forecast AI provides the bigger picture.
Summary
Xert Forecast AI (XFAI) brings the power of artificial intelligence to your training – helping you plan, predict, and perform. It combines advanced modeling, adaptive scheduling, and real-time feedback to ensure every ride, run, or workout moves you closer to your goal!
- Xert Progression Management Chart
The Xert Performance Management Chart, commonly known as the XPMC, displays several key metrics essential for tracking your fitness progression. It includes your daily Training Load, Form, and activity XSS, represented as matchsticks to visualize your Low, High, and Peak XSS.
Note: You can adjust the timescale of the XPMC by using the date-picker at the top of the Progression tab. The default options include Past 2 weeks, Six Weeks, 3 months, Year-to-date, Year, & Forever.
Additionally, the chart features your Threshold Power as a dashed yellow line and highlights any Breakthrough Performances with multi-colored medals:

You can also click & drag to zoom in on particular regions of interest in your XPMC. If you have a Forecast AI training program or have manually planned activities in your fitness planner, use the ‘Hide Future Activities’ toggle to show/hide these activities in the XPMC chart:

- Xert Relative Power
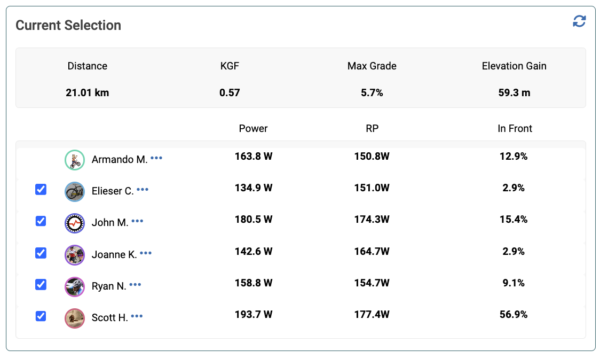
Xert Relative Power (XRP) quantifies how much power a typical male cyclist, weighing 75 kg, would need to produce in order to match the power of another rider, all else being equal*. The calculation used in Xert is:
Relative Power = Power * (75/mass)^kge
where mass is the weight in kilograms of the other rider and kge is the Kilogram Exponent (KGE). KGE is determined based on the gradient. The higher the gradient, the higher the KGE value.
For example, if a 65kg rider is generating 300W where the KGE is 0.7, the Relative Power is 300*(75/65)^0.7 = 332W. They would have a 32 watt advantage over a the 75kg rider.
* A rider can improve their Relative Power by reducing weight but also by improving other factors such as aerodynamics, rolling resistance, bike weight, and position on the bike.
- Xert Strain Score
Xert Strain Score, also called XSS, quantifies how much strain an athlete endures during an activity. By taking strain, which is measured as the amount of work performed close to MPA, and normalizing it with the athlete’s Fitness Signature, one-hour at Threshold Power equates to 100 XSS. Note that an athlete can experience greater than 100 XSS in an hour if the work is performed under short-term fatigue. That is, 100 XSS is one hour at Threshold Power, unfatigued. Under fatigue, one hour at Threshold Power can be much higher than 100 XSS.
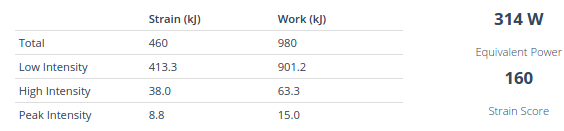

Importantly, XSS can be subdivided into low (XLSS), high (XHSS) and peak (XPSS) according to work allocation ratios – this allows Xert to create the ‘Matchsticks‘ for your activities, showing the breakdown of XSS during your activities & workouts.
Each of these strain scores can be used in separate Training Load and Recovery Load calculations which can then map to individual Impulse Response models for each Fitness Signature parameter, allowing Xert to accurately predict changes in your performance based on your recent strain accumulated. The Xert Forecast AI training programs also use this to optimize the type of training necessary to achieve a particular signature and/or training load.
- Xert Training Pacer
Xert Adaptive Training Advisor (XATA) Training Pacer
The XATA training pacer provides a visual representation of how your training is progressing over the last 7 days in relation to your Improvement Rate goal, helping you determine whether you need to train or if rest is recommended. This gauge uses your XSS surplus or deficit, available on the My Fitness page, to make these recommendations.
Xert Strain Score (XSS) measures how much strain you accumulate during your activities, with higher values reflecting a larger dose of training. For a more detailed explanation, refer to Xert Strain Score (XSS) in our glossary. The XATA training pacer gauge uses XSS to determine whether you’re on track with your training load or need to adjust.
The ATA gauge is also influenced by your selected Improvement Rate (IR), which indicates how quickly you want to increase your training load over time. IR can be adjusted from the Program tab in your account and is essential in determining your training recommendations. You can learn more about Improvement Rate (IR) in our glossary post. If you’re on target with your selected Improvement Rate goals, the needle will point to the grey area (on-pace), and if you’re ahead or behind your plan, the gauge will move accordingly.
How the Training Pacer Helps You Optimize Training
The ATA gauge helps optimize your training by indicating whether you’re on track with your goals and whether more or less intensity is needed. For example:
- On-pace: The needle is pointed near 12 o’clock position in the grey area, meaning your improvement rate is in line with your target IR.
- Ahead of plan: The needle moves right into the turquoise area, suggesting you’ve accumulated more load than necessary and may benefit from a lighter session.
- Behind plan: The needle shifts left towards the red area, indicating you need to increase training intensity and/or duration to meet your selected IR.
NOTE: A second arrow (small triangle) represents where you will be 24 hours from now and is also colour-coded with your projected training status at that time. If you have a planned activity in the Fitness Planner within the next 24 hours, the triangle may point to the right of the main needle as it is accounted for in the calculation.
Training Status Categories and Their Implications
The ATA gauge uses your Training Status to suggest training types and adjust your progression. Your Training Status is based on your current fitness levels and fatigue, and it affects the type of training Xert will recommend:
- Detraining (Brown): Indicates a significant loss in fitness and no constraints on the type of workout you can do.
- Very Fresh (Green): You’re very well-rested and can tackle high-intensity workouts without issues.
- Fresh (Blue): You’re well-rested and can tackle high-intensity workouts.
- Tired (Yellow): Your high-intensity systems need rest, but your low intensity system can still be train. The system will recommend endurance workouts.
- Very Tired (Red): Both your Low and High/Peak energy systems need rest. It’s time for a recovery day, and only ‘Active Recovery’ workouts will be recommended.
You can learn more about Training Status in our Glossary.
Limitations of the Training Pacer
While the training pacer provides valuable insights, it may not always be perfectly reflective of your progress. This can occur if activities are not consistently uploaded or synced with Xert, or if you are just returning after a small break (or from a big training camp). It’s important to ensure that your activity data is accurate and up to date for the best results from the training pacer gauge.
- XFAI
Xert Forecast AI (XFAI) is Xert’s intelligent training plan generator that creates a personalized, outcome-oriented training forecast based on your current fitness, available training time, and target goal, event, or race. Unlike the Xert Adaptive Training Advisor (XATA), which recommends what to do today, XFAI maps out your entire training journey – projecting your Training Load, Signature progression, and fitness readiness leading into your goal event.
See Xert Forecast AI for more…
- XHSS
Xert High Strain Score. See Xert Strain Score.
- XLSS
Xert Low Strain Score. See Xert Strain Score.
- XPMC
- XPSS
Xert Peak Strain Score. See Xert Strain Score.
- XSS
Xert Strain Score (XSS) quantifies how much Strain an athlete endures during an activity. By taking Strain, which is the amount of work performed close to MPA, and normalizing it with the athlete’s Fitness Signature, one-hour at Threshold Power equates to 100 XSS. Note that an athlete can experience more than 100 XSS in an hour if the work is performed under short-term fatigue.
XSS is tracked across each of your 3 energy systems: Low, High, & Peak. The ratio of Low:High:Peak is used to calculate Focus & Specificity. Throughout the website, you will see the breakdown of XSS displayed as Total ( Low | High | Peak) as well as the use of matchsticks to help you understand their meaning and use in your training.
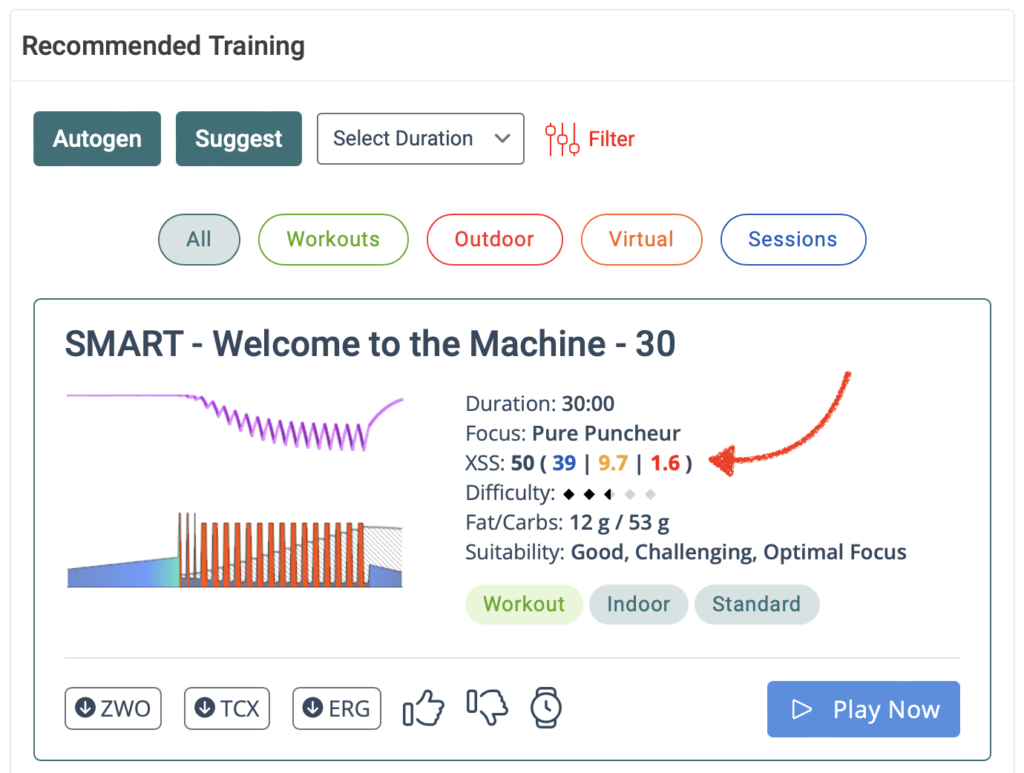
- XSS Rate
Also referred to as XSSR, it represents the work rate (power or intensity) that is equivalent to generating a given amount of XSS in one hour. It is used in workout designs to provide a way to target an intensity that will produce a given amount of strain. For example, maintaining an XSSR of 200 for 15 minutes will generate 50 XSS points (200 / ( 60 / 15)).
XSSR-based intervals often have variable power if MPA decreases or recovers during the interval. As MPA declines with fatigue, the work rate associated with a given XSSR also declines, resulting in a downward curving interval. In contrast, as MPA rises during recovery, XSSR based intervals also see a rising target power, resulting in an upward curving interval. The Xert EBC apps for Android & iOS and the Xert Workout Player for Garmin Connect IQ calculate power targets that are equivalent to XSSR values defined in Xert’s SMART workouts interactively using a complex algorithm. These intervals can also be used in combination with Target MPA intervals which make these dynamic in both intensity and duration.
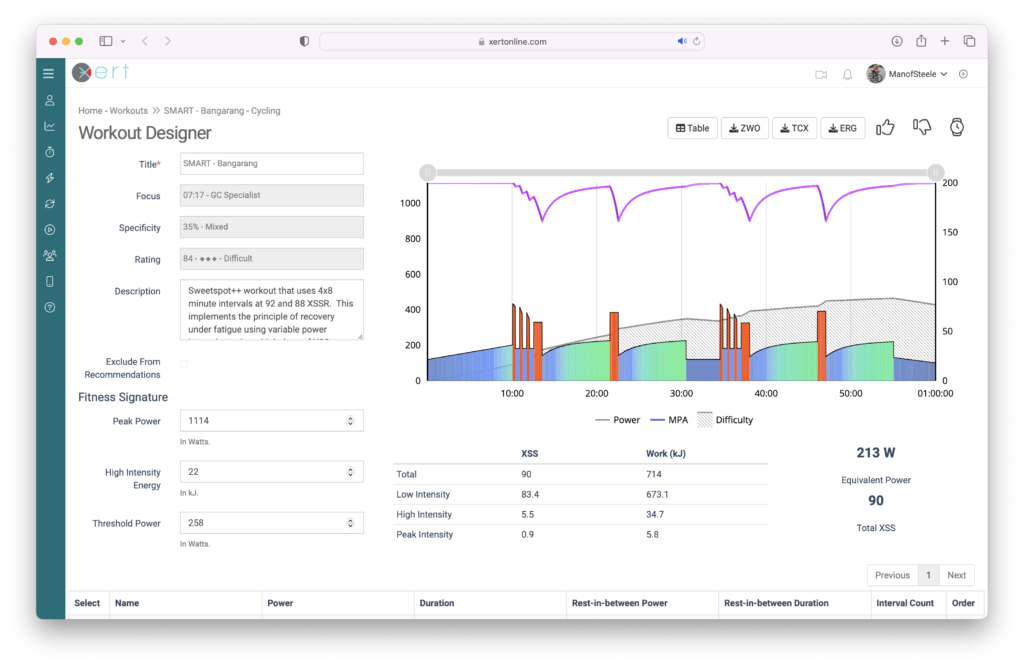
Bangarang is sweetspot workout that uses 4×8 XSSR intervals. This implements the principle of recovery under fatigue using variable power intervals to give a high dose of XSS without generating a lot of suffering.
- XSSR
See XSS Rate.
- XSSR Preference (formerly Program Difficulty)
XSSR Preference (formerly Program Difficulty) allows athletes and coaches to customize the overall degree of difficulty of their Xert training program. It’s important to note that this setting is distinct from Difficulty Score. The XSSR Preference scale ranges from 50 to 150. By default, Xert sets the value to 100, which ensures that workout durations are efficient, and high-intensity activities are challenging yet achievable for a broad range of athletes.
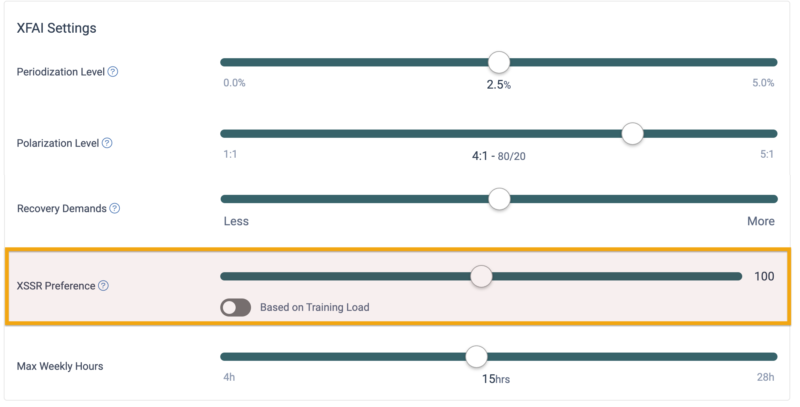
XSSR Preference can be thought as being synonymous with the difficulty of the workout or training activity. You can also think of as the efficiency or the density of the XSS you can accumulate in a given forecasted training time slot. From a planning standpoint, the greater the value, the more XSS you can accumulate with the available time you have. This can enable you to achieve higher improvement/ramp rates.
Moving the slider towards the right condenses more XSS (Xert Strain Score) into the available training time, making high intensity workouts more time-efficient but also more demanding. This adjustment may benefit athletes with limited training time, as it maximizes the effectiveness of each minute. This also makes the workouts harder to complete since you’ll need to do more XSS in a shorter time period.
Conversely, shifting the slider towards the left allocates more time to complete high-intensity activities, resulting in less time-efficient workouts with reduced overall difficulty. This option may be preferred by athletes returning from illness or injury, or older athletes seeking to avoid overly demanding workouts.
Additionally, users have the option to ‘Auto-adjust using Training Load,’ which dynamically scales the program difficulty based on the athlete’s training load/status. As training load increases or decreases, XSSR Preference will adjust accordingly.